
Three Weeks, Seven ETFs
Three Weeks, Seven ETFs: Horizon Completes Wave of New Fund Launches with Two More Actively

Three Weeks, Seven ETFs: Horizon Completes Wave of New Fund Launches with Two More Actively


What Happened Last Week All-Time Highs: Although shortened by the holiday, last week saw the
Core Bond ETF (BNDY) and Flexible Income ETF (FLXN) expand the firm’s goals-based lineup, offering


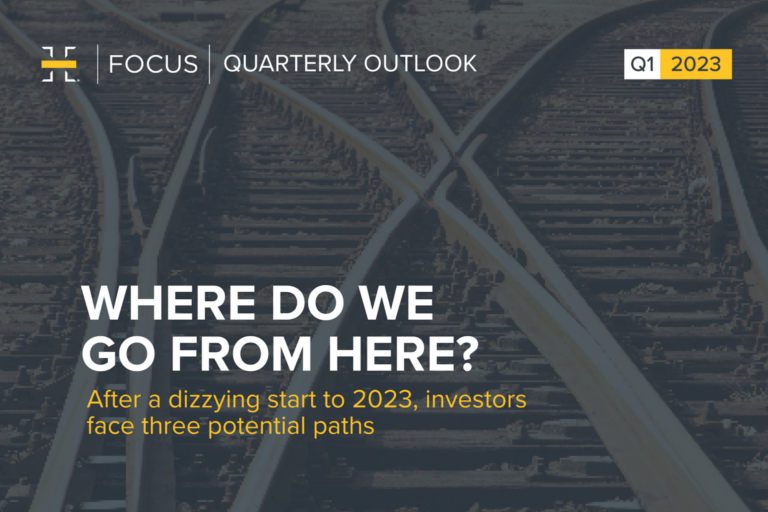
Man-made tariffs, then un-man-made, took markets on a wild ride this quarter After plummeting nearly


What Happened Last Week All-Time Highs: Investor optimism on trade and the budget bill in
Launches represent start of next wave of ETF introductions following firm’s introduction of Horizon-branded ETFs

A rising supply of homes has the potential to bring relief to would-be buyers For

What Happened Last Week Middle East Escalation: Investors largely shrugged off rising tensions last week,

Read More Askar – stock.adobe.com

Read More Renan – stock.adobe.com


Sentiment finally rises After months of feeling downbeat, consumers’ attitudes are perking up. The University
What Happened Last Week Israel Strikes Iran: Israel struck Iran’s nuclear infrastructure and senior military

Powell and co. are likely to sit on their hands for a while Fed watchers


See why we’re committed to Fueling Advisor Growth. As advisors navigate unprecedented changes, Horizon provides

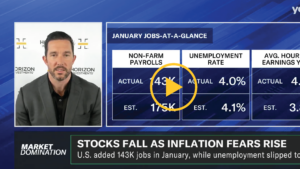
What Happened Last Week Labor Data: Friday’s non-farm payrolls report showed a slowing, but still

Consider a goals-based investment perspective going into summer The old adage “April showers bring May
What Happened Last Week Tariffs in the Courts: A trade court ruled that most of


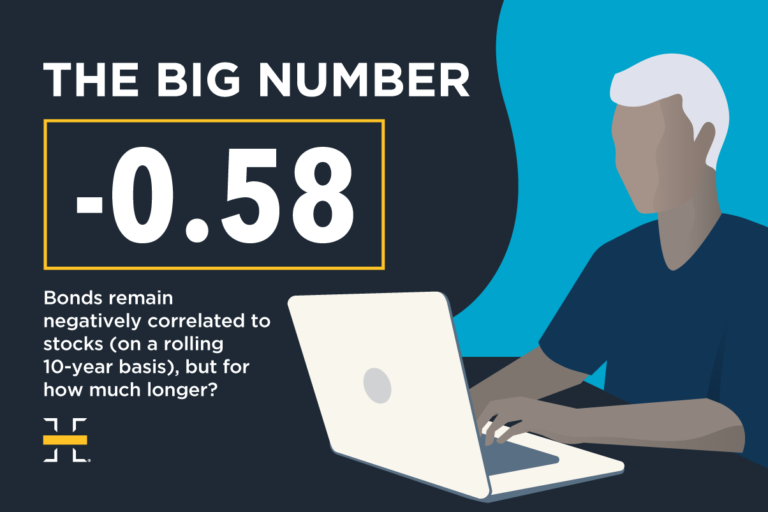
The timely importance of taking a differentiated approach to diversification Bonds these days are doing
What Happened Last Week Sell America: U.S. long-term Treasuries, equities, and the dollar all declined


Some assets may have rallied too far, too fast Investors have breathed multiple sighs of

Despite lower levies for now, uncertainty remains On Monday, the U.S. and China announced that
What Happened Last Week Markets Listless: Equity markets consolidated with notably lower volatility last week

A lengthy run for the S&P 500 These days, the stock market is showing up
What Happened Last Week Stocks Rally: The S&P 500 rallied for nine straight days to

Equity investors should look beyond the usual suspects these days This week marks the 100th
What Happened Last Week Easing Fears: Equities rallied, led by the Mag 7, as tariffs,


Market participants have fled dollar-based assets, leading to dollar weakness The U.S. dollar has experienced

CHARLOTTE, NC (April 22, 2025) – Horizon Investments, LLC, a leader in providing the financial

What Happened Last Week Yields Stabilized: Despite Trump’s consideration of firing Powell, 10-year yields declined,


Although uncertainty remains, perpetual market swings may be less frequent While still higher than what

Gain Strategies The first quarter was one of volatility and investor whiplash that felt much
What Happened Last Week Equities: The S&P 500 surged 5.7%, yet frequent trade policy reversals,

Short-Term Market Volatility Market volatility over the past week has been nothing short of historic.

What Happened Last Week Tariff Shock: Trump’s huge tariffs—a 10% baseline already in effect and

The power of diversification has been on display throughout 2025 Headline after headline this week


Tariffs are taxes and taxes slow economic growth. The Trump administration’s newly announced tariff policy

What Happened Last Week Tariff Impact: Equity markets declined following Trump’s announcement of 25% auto

History suggests a rebound could be in order The market’s smaller stocks are down—and it
What Happened Last Week Equity Consolidation: Intra-equity market volatility was calmer last week after a


What Happened Last Week Market Correction Signals: S&P 500 falls for a fourth week—one of


What Happened Last Week U.S. Sell-Off: Weak investor sentiment drove the S&P 500 to its

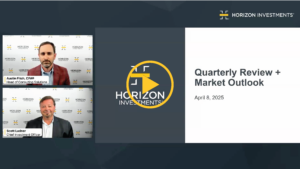
Join Scott Ladner, Chief Investment Officer, and Austin Fitch, CFA®, Head of Consulting Solutions on

Consumers may be tapping the brakes on their spending The outlook for the U.S. economy
The President Trump Seesaw: A Post-Inauguration Review of the Markets Over the last several weeks,
What Are Risk Management Strategies? Risk management strategies are systematic investment approaches to identifying, assessing,

Understanding Wealth Preservation Wealth preservation refers to protecting and maintaining your financial assets to ensure
What Happened Last Week Sentiment Souring: Policy uncertainty is likely contributing to the deterioration in

The U.S. has been lagging Europe and China in recent months. It seems “America First”
What Happened Last Week Equity Sentiment Falls: S&P 500 hits new all-time highs but small-caps

Uncertainty is spiking, but optimism remains strong. The White House’s sweeping, and sometimes see-sawing, economic
What Happened Last Week Tariffs: Markets welcomed Trump’s tariff delay, but skepticism raises the risk

Earnings have been much better than expected thus far among the market’s small companies. Large-company

What Happened Last Week Policy Uncertainty: Investors welcomed a delay in tariffs on Canada and
What Are Goals-Based Retirement Portfolios? Goals-based retirement portfolios represent a differentiated approach to asset management
What is a Goals-Based Investment Manager? A goals-based investment manager typically creates and implements personalized
Understanding Goals-Driven Investing Goals-driven investing is a unique approach to asset management that places your
What is Goal-Based Investment Planning? Goal-based investment planning is a comprehensive approach to investment management
What is Goals-Based Asset Management? Goals-based asset management is a unique financial approach that aligns

New import taxes on China, while Mexico and Canada get a reprieve for now. The

What Happened Last Week DeepSeek Dip: Tech stocks plunged due to fears of overinvestment in
What is a Goals-Based Investment Manager? A goals-based investment manager typically creates and implements personalized

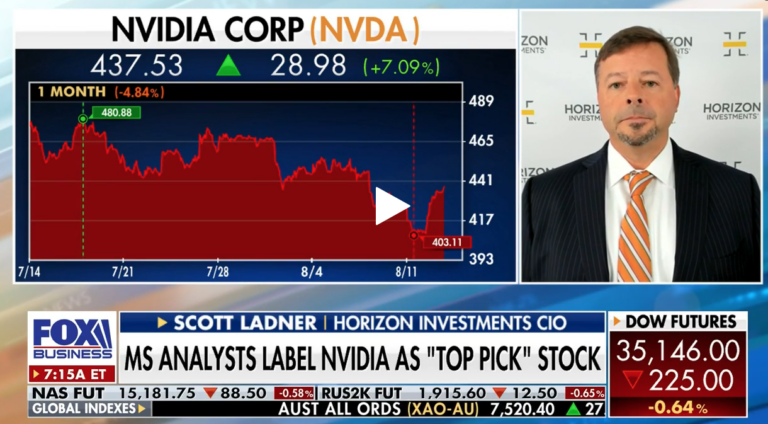
What does Nvidia’s historic rout mean for investors? The bad news: AI darling Nvidia lost
What Happened Last Week Dollar Decline: The dollar had its worst week in a year

Will Trump’s tariffs push the greenback even higher? The U.S. dollar has risen sharply in
CHARLOTTE, NC (January 23, 2025) – Horizon Investments, LLC, a provider to the financial

What Happened Last Week Lower Rates: Downside inflation surprises in the U.S. and U.K. and
Watch Now Mike Dickson sees early-year volatility as ‘normal’, with positive signs from CPI, retail
OVERVIEW Stocks posted mixed results during the fourth quarter of 2024. Investors were initially encouraged

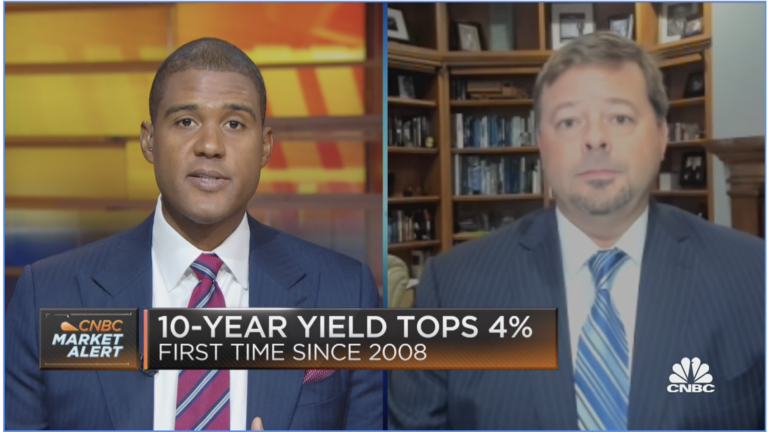
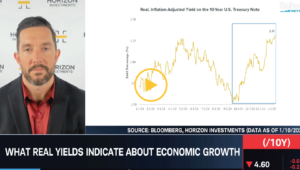
Will the U.S. economy’s growth machine keep on humming? Surging bond yields are rattling investors,

Watch Video As stocks dip and Treasury yields climb, CIO Scott Ladner remains cautiously optimistic.
Gain Strategies The choppy, volatile market environment continued in the final quarter of 2024.
What Happened Last Week Global Selloff: Stocks fell as rising yields and rate uncertainty pressured
Watch Video Despite no significant changes in the economy, a shift in perspective has created

Do top-heavy markets eventually spread out? Many investors have experienced extraordinary stock market gains over
What Happened Last Week Santa Rally Fizzles: The S&P 500 closed the week ~2% below
What Happened Last Week Hawkish Cut: The Fed cut 25 bp and pointed to a

Watch Now During a recent interview with BNN Bloomberg, Zach Hill highlighted key themes for

Small-cap stocks may offer tactical opportunities. Investors who expect a late-year, post-election rally in small-company
What Happened Last Week Equity Reprieve: U.S. large-cap gains paused last week despite a rally

Watch Now Broadcom hits a record high after proving nay-sayers wrong. How will the custom

The digital currency seems to have the wind at its back these days. An ongoing
What Happened Last Week Fresh All-Time High: S&P notches another ATH, supported by mega-caps. Price


Opportunities outside of the top performers. It’s no secret that a small number of stocks
What Happened Last Week All-Time Highs: Both domestic large- and small-caps hit fresh all-time highs

What Happened Last Week Stocks Rose: S&P 500 closed within a hair of all-time highs

The latest homebuilder data could provide some promising signals for the housing market. Chief Investment

Positive earnings surprises are back on track. With more than 90% of the companies in
CHARLOTTE, NC (November 19, 2024) – Horizon Investments, LLC, a leader in providing the financial
Chief Investment Officer Scott Ladner dove into the key forces shaping today’s markets during a
What Happened Last Week Price Action: Headline equities sold off as investors digested marginally hawkish
While inflation remains sticky in areas like services and housing, Mike sees an opportunity to

Recent election results bring a 2016 vibe back to the market, with U.S. stocks currently
What Happened Last Week Republican Election Sweep: Republicans granted a strong mandate to pursue an

Investors saw sharp market movement the day following the election Donald Trump and the Republicans

Stocks have had a habit of gaining ground no matter who becomes President. Regardless of
What Happened Last Week Yields Rose: Concerns over higher spending in the U.S. post-election caused
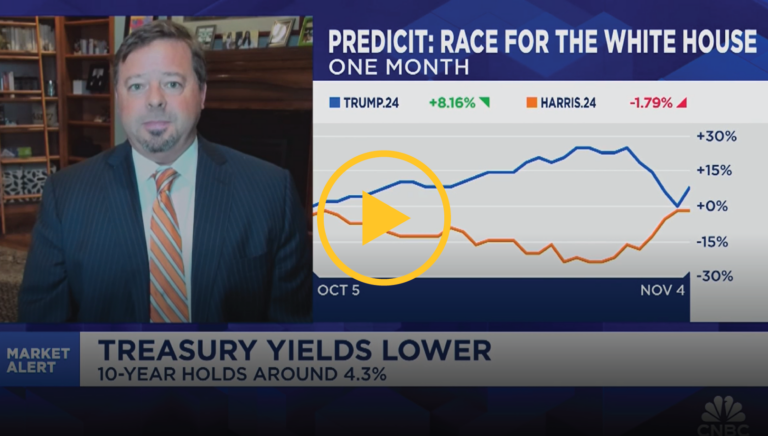
Inflation concerns, rather than growth expectations, could be behind the rise in 10-year yields, especially

Buyers need lower rates to get back in the game. In anticipation of the Fed’s
“We’re gaining on it.” The mega-cap growth to small-cap stock transition that is. A solid
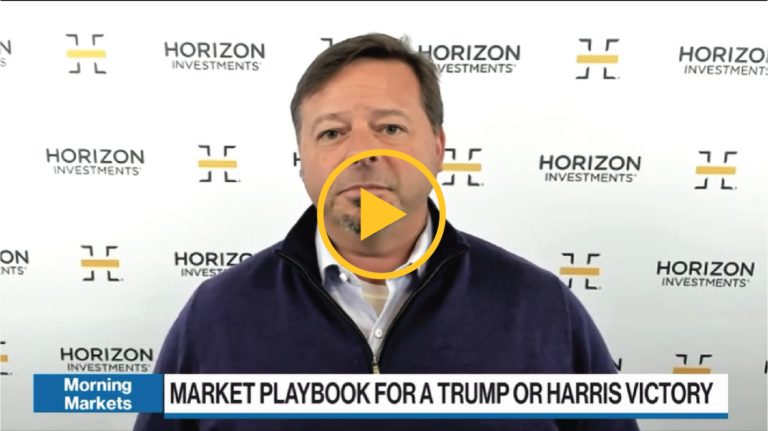
Chief Investment Scott Ladner joined BNN Bloomberg to discuss potential impacts of the U.S. election
What Happened Last Week Yields Pushed Higher: Talk of fiscal worries added to the existing
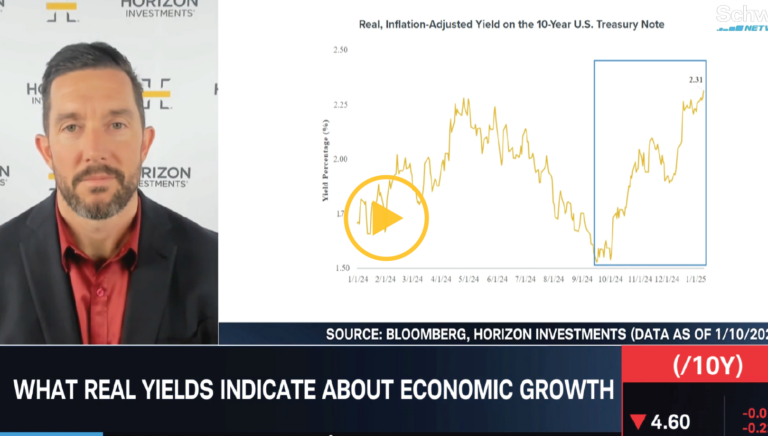
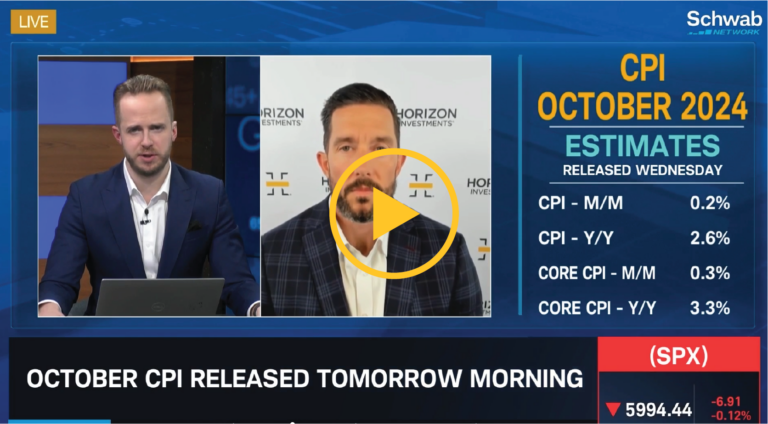
Head of Research and Quantitative Strategies Mike Dickson joined Schwab Network to highlight the U.S.’s

Consumer spending, corporate earnings, and the overall economy remain robust. Investors will examine one of
What Happened Last Week New All-Time High: S&P 500 notches new all-time highs and posted

We think a “barbell approach” combining both sectors and ETFs may be beneficial to balance
OVERVIEW Stocks posted another quarter of positive returns — despite some significant volatility along the
“We’re looking under the hood of the micro,” says Horizon Investments’ Zach Hill. He looks

The stock market is two years (and counting) into a bull market. Last Saturday marked
What Happened Last Week Price Action: Fresh all-time highs in U.S. large caps on bank
Gain Strategies Despite returns of over 5% for both global stocks (MSCI All Country

Lowest spreads in nearly three years Want more evidence that the U.S. economy is in
Chief Investment Officer Scott Ladner and Head of Consulting Solutions Austin Fitch, CFA®, review the
Chief Investment Officer Scott Ladner joined BNN Bloomberg for a wide-ranging conversation on the post-COVID
What Happened Last Week Geopolitical Volatility: Oil soared over 9% as investors weighed Israeli retaliation

It’s been 17 years since we’ve seen a weekly return this strong Long-suffering Chinese stocks
How do you harness the resilience of the U.S. consumer? With steady wage gains and
During a recent conversation with Schwab Network, Chief Investment Officer Scott Ladner highlighted three key
With recent Chinese stimulus measures stirring excitement in the markets, it’s easy to get caught
Defensive stocks have come into focus as global tensions have risen in recent weeks –
What Happened Last Week China: Property market support was announced over the weekend in major

Which sector has been leading the rally so far in 2024? One market sector has
What Happened Last Week Fed: Equities rallied as the Fed cut 50 bps to kick
https://www.youtube.com/watch?v=-f7S0cz_D-4&t=95s We remain bullish on equities, anticipating that continued support from the Fed will drive

What Happened? The Federal Reserve (Fed) started their much-awaited easing cycle on Wednesday after holding

Are you ready? All eyes are on Jerome Powell on Wednesday as investors await the
What happened last week Stocks Rebound: U.S. large caps posted their best week of the

Successful investing doesn’t have to be a thrill ride. Anyone who has driven California’s Pacific

Election Season: A Time for Ballots, Not Drastic Portfolio Changes When major elections are near,
September holds its notorious history of challenging stocks. How could interest rate cuts affect the

Regardless of stabilized delinquency rates and healthy debt-to-income ratios, consumers do not believe this is
What happened last week Price Action: Poor September seasonality may be to blame for a
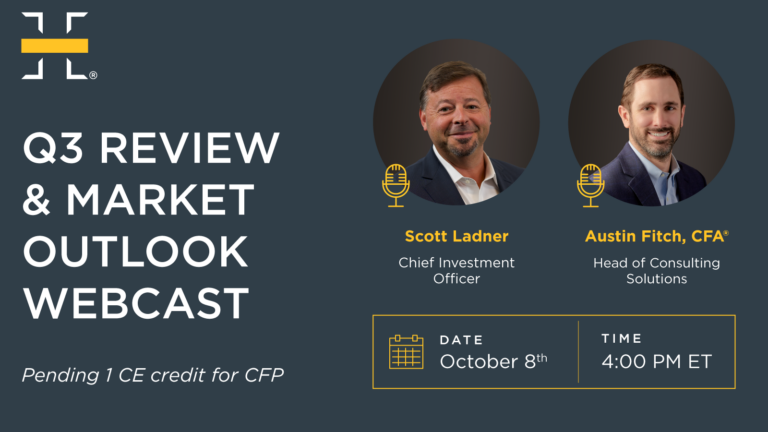
Join us at 4:00 PM ET on Tuesday, October 8, 2024, for Horizon’s Quarterly Webcast,

Here’s how stocks may perform for the rest of 2024 As the fall harvest season
Despite Nvida’s recent slump, the market kept moving. Chief Investment Officer Scott Ladner joins Schwab
What happened last week NVDA: Nvidia’s (NVDA) beat and raise was not enough to impress
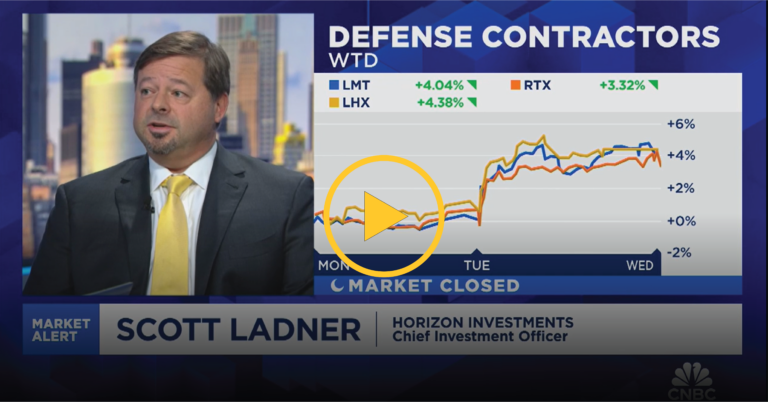
Watch out above. Here comes revenue per employee. Chief Investment Officer Scott Ladner joins CNBC

Fed Chair Powell tees up the long-awaited rate cut Fed Chair Powell said just about
What happened last week Powell Pivot: Chair Powell validated the market’s view that a rate
Conventional economic thinking may not have a place in today’s market cycle. Head of Portfolio

Best week of 2024 for the S&P 500 After a brief summer slump and a
What happened last week Market Recovery: S&P rallies to within 2% of its all-time high.

Homebuilders and housing stocks may be a smart first play for the anticipated September cut

U.S. company profits continue to impress. Earnings season is in the home stretch, with more
What happened last week Price Action: U.S. and global stocks ended the week practically unchanged

Slower numbers do not necessarily mean weak numbers. Chief Investment Officer Scott Ladner joins BNN
The markets have shown remarkable resilience, rebounding from last Monday’s sell-off. But is it time
The S&P 500 fell 3% on Monday—its biggest one-day decline in nearly two years—amid growing

Market volatility spikes—but how much should you worry about it? The first full week of
What happened last week Price action: Summer liquidity, poor economic data, a less dovish than
The recent market volatility should prompt investors to take a deep breath and evaluate their

A growing number of stocks are having their moment in the sun Everybody loves a
What happened last week Price Action: Small-caps continued to outperform year-to-date leaders, like the tech-heavy

Don’t read too much into harbingers of stock market doom and gloom Sometimes, it pays—literally—to
What happened last week Equity Market Reversion: Small-caps outperformed mega-cap technology by a little less
Overview Overall, stocks delivered another quarter of strong gains during the three-month period ending June

Will softness in housing inflation, jobs, and other metrics prompt the Fed to act soon?
What happened last week Softening Economic Data: Cooler than expected inflation data weighed on interest
Gain Strategies Global stocks continued their upward march in the second quarter, powered higher

Chief Investment Officer Scott Ladner and Head of Consulting Solutions Austin Fitch, CFA®, review the
What happened last week Price Action: MAG-7 leads U.S. equity indices to fresh all-time highs

Will we see broader market growth beyond the tech giants? Head of Portfolio Management Zach
Will the next round of AI earnings be impressive – or lackluster? Chief Investment Officer

Six more months! Six more months! Investors cheered as stocks ended the second quarter last
What happened last week Reversion Price Action: Year-to-date equity trends continued their reversal last week;

Is the seventh month of the year a stock investor’s best friend? While scorching temperatures
What happened last week AI vs. the Rest: Year-to-date equity trends reversed last week as
Head of Portfolio Management Zach Hill, CFA®, joins BNN Bloomberg to share our thoughts on

Would a September rate cut be a political move? Chief Investment Officer Scott Ladner joined

Are there potential opportunities beyond the handful of big stock market winners? The equity market
What happened last week All-Time Equity Highs: Another week of new highs for U.S. large-caps
Are we in for a slow summer with the Fed? Head of Portfolio Management Zach

Falling bond market volatility could support equity prices. Investors looking for signs of what stocks
What happened last week AI Theme: NVIDIA (NVDA) rally to $3T in market capitalization vaults

Potential homebuyers are hitting the brakes. What could that mean for the future? Would-be homebuyers
What happened last week Revenge of the Meme Traders: Small-caps outperformed large-caps on resurgent trading

Thanks to AI, it seems a bunch of people want Nvidia’s semiconductors. Is it Nvidia’s
With GDP and inflation slowing, keep in mind our strong starting place. Chief Investment Officer
What happened last week Semis: NVDA’s “beat and raise” earnings report reignited the AI trade

Where do you go from yesterday’s Fed-induced sell-off? CIO Scott Ladner joins CNBC Worldwide Exchange

Should investors consider opportunities in global stocks? We believe international stocks could deserve a place
Utilities are the top performing sector this quarter. Is this the next AI play? Chief
What happened last week Price action: China led on a green week for global stocks,

Are U.S. consumers ready to go more rounds? “When will the consumer finally crack?” is
Finding a balance between growth potential and low-risk investments can be essential for long-term retirement
What happened last week Price action: The S&P 500 rose higher and through key technical

Generating goals-based income with an equity-centric, globally diversified portfolio. Memo to retirees seeking sustainable spending
https://www.youtube.com/watch?v=K_2CoH-Ju1o&t=8234s%20 Chief Investment Officer Scott Ladner joins Bloomberg to discuss large vs small business confidence.
Is the Fed out of play as a market catalyst at this point? Chief Investment
What happened last week Earnings: Strong earnings from AI-exposed mega-cap technology supported a modest rally

It’s a big week for news from corporate America. Earnings season is in full bloom,

OVERVIEW Stocks during the first quarter of 2024 extended the rally that began late last
What happened last week Stocks rose for the first time in four weeks on the

Middle East conflicts shouldn’t derail the strong domestic growth story. Rising Middle East tensions caused
What happened last week Equities fell for the third consecutive week as rates continued to
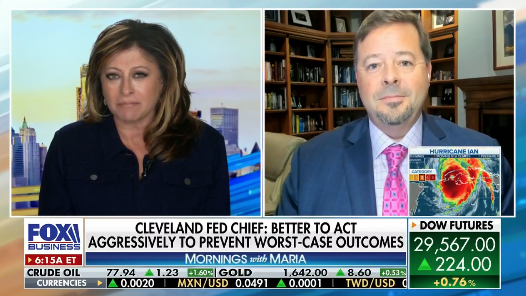
Chief Investment Officer Scott Ladner joins Mornings With Maria on Fox Business to analyze this
Chief Investment Officer Scott Ladner breaks down the chips and the materials and energy sectors

Can economic growth tailwinds outweigh higher interest rates? Month-over-month retail sales for March topped economist
What happened last week Equities sank as the 10-year Treasury yield surged above 4.5%. Third
Chief Investment Officer Scott Ladner and Head of Consulting Solutions Austin Fitch, CFA®, review the

Head of Research & Quantitative Strategies Mike Dickson, Ph.D, joins BNN Bloomberg to discuss pivoting
Gain Strategies Global stocks put in another strong quarter to start 2024 as continued

Can company profits exceed rising expectations? First quarter 2024 earnings season kicks off this week,
What happened last week The second quarter opened with a whimper as stocks declined and

First-quarter returns suggest the market may have more to give. Stocks went out like a
What happened last week Holiday-shortened week ends 1Q 2024 – U.S. equities (S&P 500) rose
Accelerating inflation and long-term growth have tilted the balance in favor of the hawks. Head

Derivatives can be effective when you know what you’re buying or selling. Covered call option
What happened last week Dovish central bank policy meetings resulted in fresh S&P 500 all-time

Keeping a close eye on Treasury market volatility Volatility in the Treasury bond market is
What happened last week Last week’s price action was choppy and lacked a cogent narrative.

Taking a tactical approach to “junk” bonds Yield-hungry investors eyeing an eventual Fed rate cut
What happened last week Mega-cap tech underperformed the broad market and equal-weight indices as market
Head of Research & Product Development Mike Dickson, Ph.D., joins Schwab Network to discuss his

Prices of many services are heating up again. Last week, we learned that the Fed’s

The market has done well in the face of repricing to half of their initial
We expect market broadening within the S&P rather than small or mid-caps. Chief Investment Officer
What happened last week Stocks rose as mega-cap tech and theAI theme continued to propel

Eventually, many clients will rely on the nest egg they have accumulated and preserved to

Do shares of non-U.S. companies deserve a place in your portfolio? With soaring U.S. stocks—and
What happened last week Nvidia, now a $2 trillion market-cap company, crushed lofty earnings expectations
What happened last week Hot inflation print pushed back the start of rate cuts; more

Is stocks’ extended winning streak “an offer you can’t refuse”? The S&P 500 has now

Zach reviews the 4Q23 earnings season, what Horizon anticipates from the Fed and interest rates
What happened last week A mega-cap-led rally lifted the S&P 500 above 5,000, a new
Earnings momentum, disinflation, and a global easing cycle… is the US an attractive place to

Robust consumer spending continues to support a strong economy. Last week’s impressive jobs data—employers added

Chief Investment Officer Scott Ladner joins Gregg Greenberg with InvestmentNews to share how Horizon’s goals-based
What happened last week Stocks ended the week higher on a mix of very strong

The economy and inflation are lining up as investors hoped they would. All eyes were
What happened last week Economic growth remains hot with inflation cooling – the probability of

It could be a great time to buy stocks. Here’s why. Investors celebrated last Friday

Until bazooka-style fiscal government spending is announced, we don’t see China as an attractive investment.

Navigating heightened market volatility and an evolving regulatory landscape has become the new normal for

A broader tech. trade could be the largest driver in 2024 as the market moves
China would need massive fiscal spending to get out of its balance sheet recession

We appear to be in a war-recovery-like period, going through an abrupt normalization process, which
What happened last week Action-packed and holiday-shortened trading week underscored by new all-time highs across

“Sticky” shelter costs could keep overall prices uncomfortably high. While inflation’s steady march downward of

While some headlines focus on credit card debt alone, Head of Research & Product Development
What happened last week Magnificent-7 (“MAG-7”) mega-caps led the “broadening-out” trades’ outperformers (e.g. small caps).

OVERVIEW Following a third-quarter slump, stocks roared back to life during the final three months
Gain Strategies In a topsy-turvy year for investors and economists alike, 2023 ended on a

Value and growth index fund investors may be surprised by their returns last year. Investors
Chief Investment Officer Scott Ladner and Head of Consulting Solutions Austin Fitch review the fourth
What happened last week The S&P 500 snaps its 9-week winning streak to end Friday
“This Covid cycle that we’ve just been through was not a traditional business cycle. It
What happened last week 2023 set a high bar for 2024 market-wise, although new all-time
REGISTER NOW Join Horizon’s Focus Webcast, hosted by Chief Investment Officer Scott Ladner and Head

How are the “Magnificent 7” stocks really doing? Outperformance isn’t always exactly what it seems
What happened last week Last week was a full macro week with a string of

Some crucial context on Americans’ “out of control” debt levels. “Credit Card Debt Crisis” “Credit
What happened last week The S&P 500 has rallied for its sixth straight week, retracing

Most stocks have been laggards this year, but that could be starting to change. It’s
What happened last week A strong seasonal rally is in full swing as the S&P

Chief Investment Officer Scott Ladner discusses his outlook for markets and investment strategy. Watch Video

Will December bring glad tidings to small-company stocks? Small-cap stocks have had quite the slog

Baby boomers have been approaching retirement for a decade, bringing billions of dollars out of
What happened last week A short trading week saw the S&P 500 inch toward an
Chief Investment Officer Scott Ladner joins CNBC to discuss the divergence in stock performance between

One active approach to risk management is currently beating the market. Risk management can be
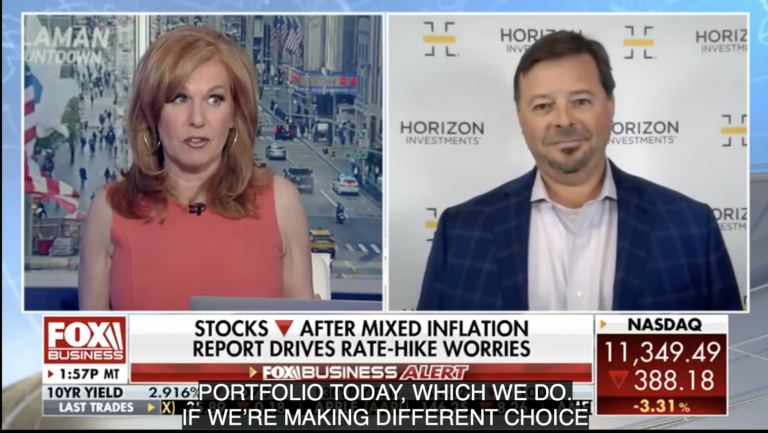
Chief Investment Officer Scott Ladner joins Fox Business ‘The Claman Countdown’ to provide investing advice.
Scott Ladner joins BNN Bloomberg to discuss the U.S. markets, and Powell’s recent comments on
What happened last week Risk sentiment increased last week, lifting the S&P 500 through key

The end of Fed rate hikes suggests good things for equities. The stock market’s surge
What happened last week Risk sentiment increased last week, lifting the S&P 500 through key

Three years of less-than-stellar financial market performance. It’s been a tough slog for investors over

MASTERCLASS: Portfolio Construction The portfolio construction process can be broken down into a series of
What happened last week Investors reduced market exposure due to geopolitical tensions weighing on equities

GDP growth over the past three months may have been huuuuuge. Third-quarter GDP growth could

House hunters are facing a shocking number these days. Pity today’s homebuyers who are looking

OVERVIEW During the third quarter of 2023, investors hit “pause” on the rally that had
What happened last week Stocks and bonds sold off as geopolitical tensions outweighed strong economic
Bond market must get ‘under control’ before stocks rise again. Chief Investment Officer Scott Ladner
Gain Strategies After a surprising and surprisingly positive first half of the year for financial
What happened last week Stocks close the week higher despite mounting geopolitical concerns and rising

https://www.horizoninvestments.com/wp-content/uploads/2023/10/Q3-Webcast-Super-TB-Small_1.mp4 Chief Investment Officer Scott Ladner and Managing Director of Consulting Solutions Austin Fitch review
What happened last week Stronger economic data and domestic political turmoil contributed to a resumption

It’s been bleak days—and lots of them—for bond investors. As the fourth quarter begins, bonds
Look Outside of the Stocks that Gained from the Inflation Trade The staples companies were

Over the summer months, Horizon conducted the firm’s first annual Advisor Sentiment Survey to gauge
What happened last week Last week, the quarter ended with both stocks and bonds mainly

The greenback’s recent rally could have legs. The U.S. dollar is lighting up the charts,
What happened last week A more hawkish than expected Fed meeting saw higher interest rate

Next-generation investing in AI will take hold in 2024 CIO Scott Ladner joined BNN Bloomberg

Falling interest rate volatility in Treasuries could herald a stock market rally. There are few
https://youtu.be/mWhUrUv0Ffo?feature=shared Hear Zach cover what Horizon is taking from recent economic data, our expectations for
What happened last week Treasury yields continued to move last week higher on strong economic

Sharply higher oil prices have the potential to re-ignite inflation. Last week saw oil prices
What happened last week Strong data drove Treasury yields higher and stocks lower in a

Historically, the 9th month of the year hasn’t been kind to investors. “April is the
What happened last week It was a recovery week for equities as yield moves continued
What happened last week A choppy week in markets saw small recoveries for stocks and
CIO Scott Ladner joined Schwab Network to discuss recent employment and inflation data, factors behind
There are few signs of the economic struggles predicted at Jackson Hole last year. Attention
What happened last week The push higher in Treasury yields drove the third consecutive week

Stock investors may want to brace for some bumps in the road. After months of
Chief Investment Officer Scott Ladner joined Fox News to provide critical tips to investors on ‘Mornings
What happened last week Pressure building on the disinflation narrative as global bond yields surge

What happened last week Negative bond market developments likely drove the sell-off in equities Jobs
https://youtu.be/e26Kr8v2gvg Head of Portfolio Management Zach Hill, CFA® covered why the Fed matters less today,

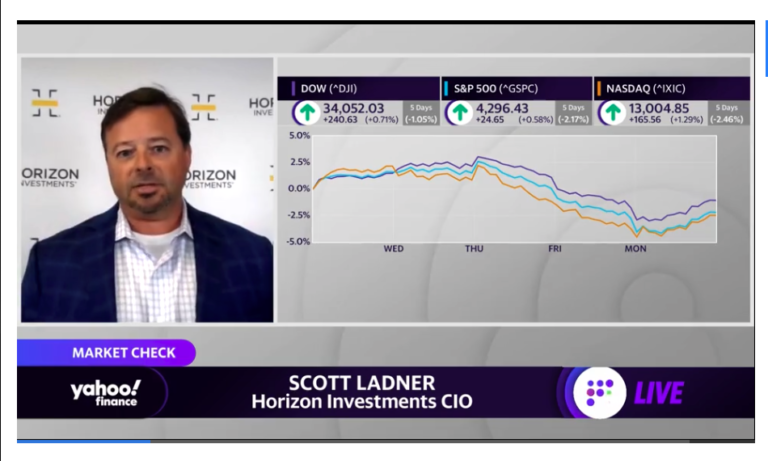
CIO Scott Ladner joined Yahoo! Finance to discuss portfolio positioning and how to prepare for

Other market sectors are showing signs of life. The S&P 500 continued its winning streak

What happened last week Stocks climbed as the Fed and European Central Bank (ECB) raised

Is the Fed’s battle to contain inflation finally done? The market seems to think so.
CIO Scott Ladner joined TD Ameritrade to discuss this week’s FOMC meeting and A.I.’s potential
What happened last week Global stocks edge higher, led by the US, in a week

Chief Investment Officer Scott Ladner joined CNBC to discuss what’s ahead for the busiest week

The S&P 500’s lowest correlation level in years suggests outperformers and underperformers should emerge. Think

When was the last time a client asked, “What was my portfolio’s alpha?” You may
OVERVIEW During the second quarter of 2023, several key equity market indices built on their
https://youtu.be/etvuMLvXBAM Chief Investment Officer Scott Ladner and Managing Director of Consulting Solutions Austin Fitch review
Gain Strategies After a furious and volatile start to the year for stock and bond

Will six months of returns cause you to forsake global diversification? While it’s true that
What happened last week Equities sold off in volatile trading to start the third quarter
Horizon Investments chief investment officer Scott Ladner analyzes the market as it enters the second
What happened last week Strong end to a strong quarter with the S&P 500 closing

Stock market volatility has fallen to multi-year lows? “Merrily, we roll along, roll along.” Those
What happened last week Stocks sold off with small caps, value, and internationals leading losses
Zachary Hill, CFA, joins ‘Squawk Box’ to discuss the latest market trends, whether stocks are

With the oldest baby boomers over eleven years into retirement and the oldest Generation X

The housing market is the latest economic indicator to light up the charts? One of
What happened last week Increasingly positive investor sentiment boosted the S&P 500 closer to all-time

Does This Market Have Staying Power? Stocks escaped the bear’s grip. What comes next Investors
What happened last week It was a quiet week, with recent trends reversing in favor

The positive surprises in the labor market just keep on coming. Job creation in the
What happened last week Friday’s strong labor market data defined the trading week. A bipartisan
A.I. could be the most important productivity-enhancing development for the global economy since the uptake

Is the fast-moving market moving too fast? Technology stocks generally hate higher interest rates. Tech
What happened last week A debt ceiling agreement was reached, and will likely become law
CIO Scott Ladner, and Managing Director Austin Fitch, CFA® discuss the debt ceiling debate, disinflation,

Active management aims to navigate trends as they emerge—and fade We believe an active, dynamic
What happened last week The market saw year-to-date highs in stocks despite a lack of

Apple is once again worth more than the entire Russell 2000 In Marvel movies, it’s

Fear-inducing headlines are likely painting too grim of a picture. Silicon Valley Bank. Signature. First
Hear Zach Hill, CFA®, cover earnings season, Fed policy, and what Horizon is watching in

Investors seem to be a relatively calm, cool, and collected bunch these days—which may be
Overview The idea that the financial markets “climb a wall of worry” by showing resilience

Identifying investment opportunities may take a sharper focus going forward Fears about banks’ financial health
Gain Strategies Investors shifted among dominant themes numerous times in what was a volatile but

What tools can investors use to fight longevity risk in retirement? Many retirees today probably
There’s tech, and there’s the rest Investors in tech stocks these days are a wildly

Key Takeaways Investors require different outcomes from their investments, a one-size-fits-all passive approach is unlikely

Here’s something we have only seen once in 20 years In a true study of
Scott Ladner and Austin Fitch discuss the Fed announcement and the current market and what

Stocks stand to benefit if the Fed eases up on the brakes Continued concerns about

Bank woes raise questions about the Fed’s next move. Investors’ sudden hunger for U.S. government

Chip stocks have come out swinging to start 2023 In what could be a harbinger

The U.S. real estate market has been flexing its muscles in recent weeks. Unexpected strength
“The U.S. economy looks pretty strong, and we think that will feed into corporate profits.”

U.S. stocks have clearly perked up so far this year. But now, two key market
https://www.horizoninvestments.com/wp-content/uploads/2023/02/Fast-Take-Final-Video.mp4 Hear Zach Hill, CFA®, Head of Portfolio Management, cover Horizon’s thoughts on the state

In the consumer market, high-quality products are identified as reliable, longer lasting, and are generally

In the wake of a bruising 2022, investors seem to have decided that “risk on”

Expected interest rate volatility has fallen 28 points so far this year The financial markets
Gain Strategies The final quarter of what has been a difficult year for asset owners

Overview Financial markets suffered sizable—in some cases, historic—losses in 2022. Soaring inflation combined with an

Investors eye foreign markets and like what they see. For more than a decade, international

Put “protection” has come up short lately—but there’s a better way. Put options are often


Up is down, and down is up Two key components of the equity market—growth stocks

Hear Scott talk about areas of the market to watch in 2023, and his expectations
Scott provides insight on the state of the market.


“For tech and communication services, there was this belief that those revenue streams were impervious
Ladner: We think there will be a lot of tailwinds for the markets in the
https://www.horizoninvestments.com/wp-content/uploads/2022/12/Zach-Hill-V5.mp4 Hear Zach Hill, CFA®, Head of Portfolio Management, cover Horizon’s thoughts on what’s ahead

This year we have seen a first for stocks and bonds. Welcome to uncharted territory.
Zach Hill, CFA® discusses concerns around markets and the economy in 2023 on Mornings with

Everybody can appreciate a smooth ride—and for investors, a journey without too many bumps along

Throughout 2022, investors have seen various positive economic developments as signs that the Federal Reserve
Scott Ladner recently appeared on ‘Mornings with Maria’ with Fox Business to review inflation, the

Zach Hill, CFA® joined Nicole Petallides on TD Ameritrade Network to discuss the takeaways from

Could bond investors find the next few months to be “the most wonderful time of

Horizon’s Head of Portfolio Management, Zach Hill, CFA®, joined Squawk Box Friday to discuss the
https://www.horizoninvestments.com/wp-content/uploads/2022/11/Zach-Hill-Fast-Take-FInal-Video.mp4 Hear Horizon’s thoughts on quarterly earnings, Fed policy, and market outlook. Disclosure: The commentary

Investors won’t have to dip into their savings to pay for their Thanksgiving feasts this year,
Investors are shifting gears in the wake of good inflation news. Will it last? The

“The market is – as it has been a few times this year – very

The losers of the past are riding high—while yesterday’s winners appear to be out of
CIO Scott Ladner joined Yahoo Finance Live to discuss Fed policy and inflation, economic data,

We’re more than halfway through the third-quarter earnings season, and thus far, the S&P 500

Scott Ladner joined Nicole Petallides on TD Ameritrade’s ‘The Watch List’ to discuss the market,
Ron Saba weighs in on shifting focus from tech stocks to so-called value stocks in

The squeeze on homebuyers appears to be getting tighter by the month—which could spell trouble

Horizon’s Head of Portfolio Management, Zach Hill, CFA®, discussed his expectations for earnings estimates, the

CIO Scott Ladner joined Maria Bartiromo on Fox Business to discuss the impact of inflation
Zach Hill, CFA® shares his expectations around negative demand, the next Fed meeting, and his
Horizon Investments CIO Scott Ladner explains the lull in chip demand and why now is

“It’s interest rates that are driving equity volatility, that is the way we have been

We all know that last week’s inflation report showed headline inflation continues to surge, with
Central bankers have become laser-focused on crushing inflation. What could that mean for the economy
Gain Strategies This year’s punishing price action across markets continued last quarter as global stocks

Head of Portfolio Management Zach Hill, CFA® joins Yahoo! Finance to weigh in on recent

CIO Scott Ladner joins BNN Bloomberg to discuss the BOE announcement, global growth, and sectors.
CIO Scott Ladner joins CNBC to discuss Treasuries, the Fed’s next moves, and the impact

It’s a game of “catch me if you can” between investors and the Fed these
CIO Scott Ladner argues housing leads the economy and will cause a market ‘softening’ as
Tomorrow, the Federal Reserve Board is set to announce its latest decision regarding interest rates.
“The recent CPI report threw cold water on hopes that the Fed could ease up

All eyes were once again on interest rates last week, as the European Central Bank

Head of Portfolio Management Zachary Hill, joined CNBC Worldwide Exchange to discuss the markets ahead
https://www.horizoninvestments.com/wp-content/uploads/2022/09/Fast-Take-With-Zach-Hill.mp4 Hear Horizon’s view of the markets as we head into the fall, along with
Chief Investment Officer Scott Ladner, joined Cheddar News’ Closing Bell to discuss U.S. stocks after

Chief Investment Officer Scott Ladner joined ‘Morning with Maria’ to weigh in on the August

“Nominal GDP slowdown has been baked in the cake. The stock market today has started

Demand for new homes is way down. What does that mean for investors? New home

Historical Recessions Given the increase in signs of a cooling economy, this study aims to

It’s a safe assumption that when Bob Dylan sang “the first one now will later

What a difference a couple of months can make. Since hitting its low point (closing

Is More Volatility Coming Down the Pike? Investors looking for greater clarity about the road
As investors digested both the Fed’s decision to raise interest rates by another 75 basis

The U.S dollar continues its steady march higher, up 14.7% during the past 12 months.
Scott Ladner, CIO of Horizon Investments, joins Worldwide Exchange to discuss his views on inflation

Overview Investors faced a wall of worry during the second quarter that proved to
Gain Strategies The second quarter of 2022 was another difficult one for asset markets
Over the next few weeks, a steady stream of second-quarter earnings reports will reveal how

The S&P 500 hasn’t seen two consecutive quarters of negative returns since the global financial

Economists surveyed by the Wall St. Journal now say there’s a 44% chance of a
Zach Hill, CFA and ERShares COO Eva Ados joined Yahoo Finance Live after the closing
Red-hot inflation, and the Fed’s now-aggressive efforts to fight it, are pushing up mortgage rates
Zach Hill, CFA®, head of portfolio management at Horizon Investments, says this bear market is
CIO Scott Ladner joined Brigg MacAdam LTD founding partner Greg Swenson and Rosecliff Capital CEO

American workers are reliving the past – and that’s a potentially big problem. The reason:
Equity markets sent investors smiling into the Memorial Day weekend, thanks to the biggest weekly
CIO Scott Ladner joined Bloomberg to share his expectations for the market and why boring

With the Nasdaq plummeting 27.2% and the S&P 500 Growth Index close behind at -26.2%,

https://www.horizoninvestments.com/wp-content/uploads/2022/05/Horizon-Investmenst-Mid-Quarter-Update-Small.mp4
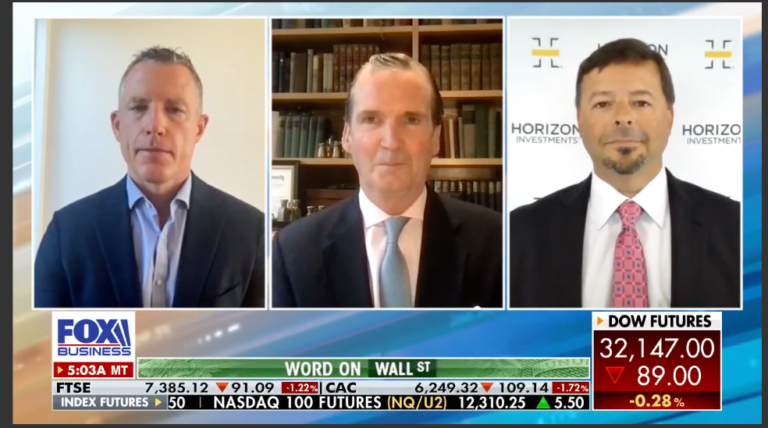
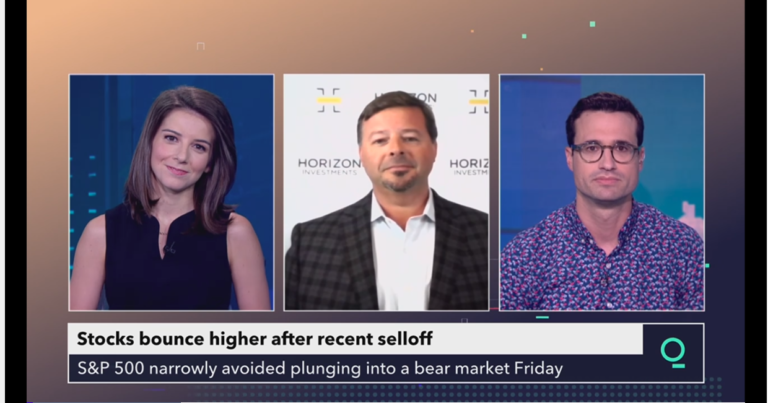
Last week ended with the S&P dipping briefly into bear market territory before closing higher
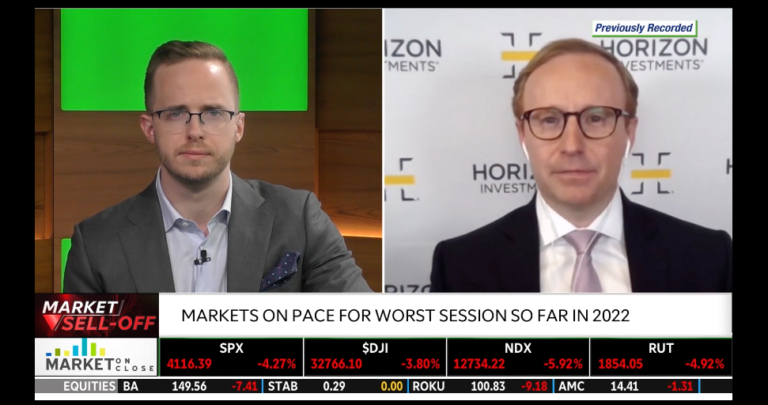
CIO Scott Ladner joined Liz Claman to discuss this week’s market sell-off and share his
Investors in balanced portfolios these days may feel like they’ve fallen off a tightrope. The

Scott Ladner talks macroeconomics and a global view on markets with Ausbiz.

“…unless supply chains heal rapidly or workers flood back into the labor force, any equity
Stocks fell hard Thursday, May 5, 2022 following the FOMC meeting announcement in which the

Investors have been dumping high growth stocks for weeks, due to worries about inflation, rising

Scott Ladner on air for Mornings with Maria Bartiromo. Scott sheds light on the micro
Scott Ladner joins Kristina Hooper after the closing bell yesterday on Yahoo Finance to discuss

There’s something strange happening with energy ETFs. Zachary Hill, CFA comments on the sector’s flagships

The broader tech sell-off comes after the Federal Reserve announced plans to hike interest rates

Investors liked what they heard from the Fed this week. The Federal Reserve Board raised

Bonds are usually thought of as a safe haven for investors due to their lower

No doubt about it: Fixed-income investors are spooked. Volatility in U.S. Treasuries has soared this

The truth is, individual investors today don’t care as much about exposures as they do

We know that in Preservation, clients either ask or at least ponder: What product gives

Kahneman’s Behavioral Approach Noise: an unwanted variability in decision-making. Ask yourself, when am I at

Investment professionals rarely agree on the risks and direction of markets, yet many would agree

We see active financial advice as the new reality. Not robo. Not passive. But active!

U.S. companies start to report the effect of decades-high inflation on their profit margins.

“Volatility in the bond market is simply too high right now…” Zachary Hill, CFA is

As Americans become more comfortable with Covid-19’s transition from pandemic to endemic, two of our
Now that the Federal Reserve Board has started raising rates, the upcoming first quarter earnings

Zachary Hill, CFA‘s insights on the economic health from a consumer and corporate perspective.
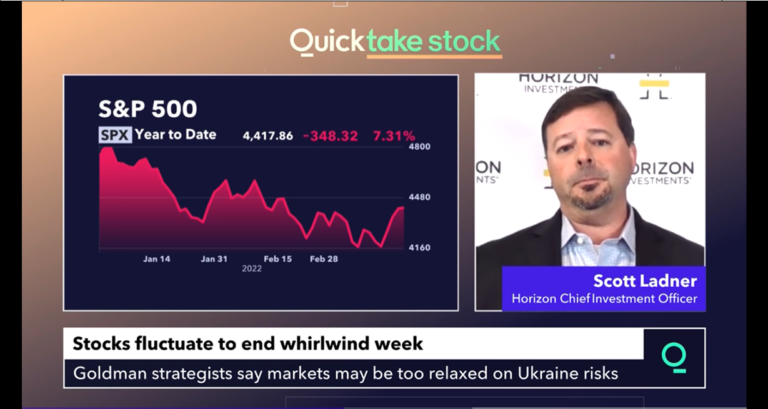
Stocks fluctuate to end whirlwind week. But have we hit the bottom?


Watch this short video as Scott Ladner discusses the current market environment, the Fed, interest

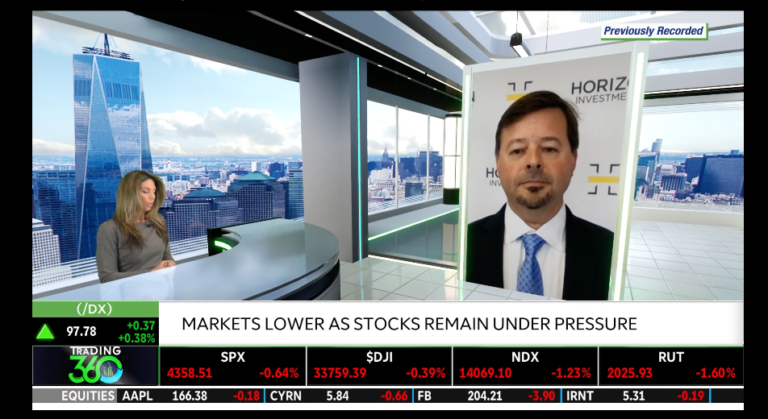
Horizon Investments CIO, Scott Ladner was on Mornings with Maria Bartiromo on Fox Business Network

Horizon Investments CIO, Scott Ladner joins Yahoo Finance Live to discuss the outlook for the
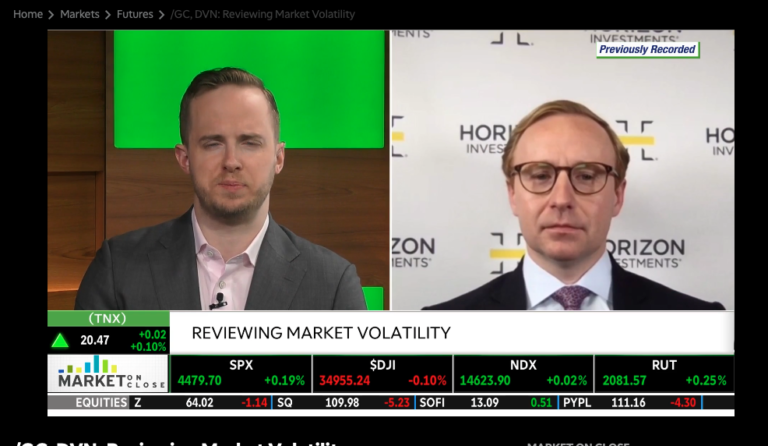
Zachary Hill, CFA, Head of Portfolio Management at Horizon Investments, reviews market volatility with TD
With such a choppy week so far in the markets, we pose the question, ‘Will
In case you missed it, check out Horizon Investments’ CIO Scott Ladner discussing his market

Listen to what Scott Ladner, Horizon CIO, and Kevin O’Leary, O’Shares, say about hedging against
Tracking alternative investments to Treasurys Kevin O’Leary of O’Shares and Scott Ladner of Horizon Investments
One sector’s secret weapon against rising inflation, according to ETF manager Alexi Panagiotakopoulos of Fundamental

Stocks closed the first trading week of 2022 in the red as investors digested a
Kevin O’Leary of O’Shares joins Scott Ladner of Horizon Investments to discuss how to invest

Flush with new cash, Horizon Investments is even better positioned to provide first-rate advice to

Check out what Zachary Hill, CFA, Horizon Investments’ Head of Portfolio Management, had to say
Tech stocks spur Wall Street slide as investors continue to monitor inflation impact
The waiting game is almost over. Zachary Hill, CFA weighs in onthe Fed’s decision coming
Investors sure are a gloomy bunch these days. How downbeat are they? According to the

As expected, the Federal Reserve Board on Wednesday raised the target range of the federal


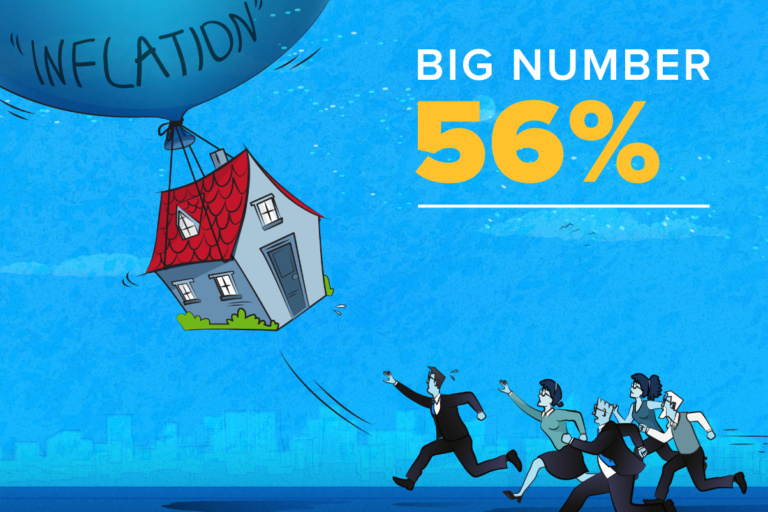
Inflation sticker shock is spreading; 55% of the items in the Consumer Price Index have
Many investors and financial advisors are still in the dark on what ESG factor investing
Inflation sticker shock is spreading; 55% of the items in the Consumer Price Index have

Inflation sticker shock is spreading; 55% of the items in the Consumer Price Index have

Inflation sticker shock is spreading; 55% of the items in the Consumer Price Index have

Inflation sticker shock is spreading; 55% of the items in the Consumer Price Index have
Inflation sticker shock is spreading; 55% of the items in the Consumer Price Index have

Inflation sticker shock is spreading; 55% of the items in the Consumer Price Index have
Inflation sticker shock is spreading; 55% of the items in the Consumer Price Index have

Inflation sticker shock is spreading; 55% of the items in the Consumer Price Index have
Inflation sticker shock is spreading; 55% of the items in the Consumer Price Index have

Inflation sticker shock is spreading; 55% of the items in the Consumer Price Index have
Inflation sticker shock is spreading; 55% of the items in the Consumer Price Index have
Inflation sticker shock is spreading; 55% of the items in the Consumer Price Index have
Inflation sticker shock is spreading; 55% of the items in the Consumer Price Index have
Eye-popping jumps in energy prices worldwide has some people proclaiming we’re in a replay
From the youngest to the oldest American workers – GenZ to Baby Boomers – their
A large swath of the GenX population, many of whom are 20 years or less

The march higher in the cost of home health, assisted living or nursing home services
American workers just got another jolt of bad news about the financial health of Social

Federal Reserve Chairman Jay Powell repeated his view at last week’s Jackson Hole meeting that

There’s a record-breaking chasm opening up between American and Chinese stocks this year. The SPDR
The Baby Boomer retirement wave, egged on by Covid, rolls on. Another 248,000 Americans over

The Baby Boomer retirement wave, egged on by Covid, rolls on. Another 248,000 Americans over

You’ve likely heard that second quarter profits are surging, driven by easy year-over-year comparisons and

Target date funds operate under the assumption that someone’s asset allocation should follow a glide
Yet another setback for retirees who view traditional fixed-income investments as a secure way to

The July 4th holiday’s fireworks extended into the work week on Wall Street. The 10-year

The Federal Reserve’s meeting last week sparked a selloff in stocks and bonds as the

Capturing the pandemic’s weird real-world effects is reflected in how high above trend retail sales

Bidding wars for homes has soured people on reaching for the American dream: for the

What was a rumbling of change in the last few years is now barreling into
What was a rumbling of change in the last few years is now barreling into
They’re very different Presidents, but what Joe Biden and Donald Trump have in common is

They’re very different Presidents, but what Joe Biden and Donald Trump have in common is
They’re very different Presidents, but what Joe Biden and Donald Trump have in common is

Millions of workers are retiring early. But not necessarily because they want to. The pandemic
When financial markets went haywire in March 2020, people pursuing a traditional financial plan may

Of all the financial challenges facing retirees, being a widow can be one of the
Nearly every day the financial news headlines trumpet the selloff in bonds and the rising

A common investor assumption is that bonds tend to go up in value when the
Like the famous Energizer Bunny, small-capitalization stocks keep on going versus their larger peers. Year
They’re very different Presidents, but what Joe Biden and Donald Trump have in common is
On Wednesday, March 10, 2021, Scott Ladner, Horizon’s Chief Investment Officer, spoke with CNBC Pro’s
Does 2021 strike you as a replay of 1999? The investment theme now, as it

Many investors and financial advisors are still in the dark on what ESG factor investing

A common investor assumption is that bonds tend to go up in value when the

Federal Reserve chairman Jay Powell’s speaking engagement on March 4 is, in Horizon’s view, critical
Up, up and away for the price of a new single-family home, which reached a
Investors who are globally diversified may be seeing that pay off at the start of
Inflation isn’t a problem now, but financial markets are saying it could be soon. Traders
Here’s another knock against putting all of your retirement-income eggs in the bond market basket.
A common investor assumption is that bonds tend to go up in value when the

A common investor assumption is that bonds tend to go up in value when the
A common investor assumption is that bonds tend to go up in value when the

A record high for stocks…again. Earnings get much of the credit for the latest move.
When stocks fall, bonds rally. That’s standard market action today. And it makes bonds look

Three Weeks, Seven ETFs: Horizon Completes Wave of New Fund Launches with Two More Actively Managed Funds Nasdaq 100 Defined Risk ETF and Digital


What Happened Last Week All-Time Highs: Although shortened by the holiday, last week saw the major indices make fresh all-time highs. Labor Data: The jobs
Core Bond ETF (BNDY) and Flexible Income ETF (FLXN) expand the firm’s goals-based lineup, offering new tools for advisors to meet client objectives CHARLOTTE, NC


Man-made tariffs, then un-man-made, took markets on a wild ride this quarter After plummeting nearly 19% on tariff fears, the S&P 500 staged a truly


What Happened Last Week All-Time Highs: Investor optimism on trade and the budget bill in DC sent the S&P 500 to fresh all-time highs. Oil
Launches represent start of next wave of ETF introductions following firm’s introduction of Horizon-branded ETFs in Q1 2025 CHARLOTTE, NC (June 26, 2025) – Horizon,

A rising supply of homes has the potential to bring relief to would-be buyers For years, Americans have lamented that rising housing prices and elevated

What Happened Last Week Middle East Escalation: Investors largely shrugged off rising tensions last week, assuming a weakened Iran will quickly back down. Weekend Bombing:

Read More Askar – stock.adobe.com

Read More Renan – stock.adobe.com


Sentiment finally rises After months of feeling downbeat, consumers’ attitudes are perking up. The University of Michigan Consumer Sentiment index (one of the oldest gauges
What Happened Last Week Israel Strikes Iran: Israel struck Iran’s nuclear infrastructure and senior military leadership, leading to open conflict between the two nations. Cooling

Powell and co. are likely to sit on their hands for a while Fed watchers may want to consider taking the summer off this year.


See why we’re committed to Fueling Advisor Growth. As advisors navigate unprecedented changes, Horizon provides the solutions and support to help transform their practices and

What Happened Last Week Labor Data: Friday’s non-farm payrolls report showed a slowing, but still a healthy labor market. Broadcom Earnings: Broadcom (AVGO) disappointed investors

Consider a goals-based investment perspective going into summer The old adage “April showers bring May flowers” proved true on Wall Street this year. After falling
What Happened Last Week Tariffs in the Courts: A trade court ruled that most of President Trump’s tariffs are illegal, yet he increased levies against


The timely importance of taking a differentiated approach to diversification Bonds these days are doing little to shore up investors’ bottom lines. In our opinion,
What Happened Last Week Sell America: U.S. long-term Treasuries, equities, and the dollar all declined as investors sought shelter in defensive assets and international stocks.


Some assets may have rallied too far, too fast Investors have breathed multiple sighs of relief in recent weeks as the Trump administration has dialed

Despite lower levies for now, uncertainty remains On Monday, the U.S. and China announced that they will temporarily suspend the high import tariffs they imposed
What Happened Last Week Markets Listless: Equity markets consolidated with notably lower volatility last week as investors digested the U.S.-UK trade framework and expectations for

A lengthy run for the S&P 500 These days, the stock market is showing up on both the “best of” and “worst of” lists. For
What Happened Last Week Stocks Rally: The S&P 500 rallied for nine straight days to close above pre-Liberation Day levels. Better Than Feared Data: Payrolls

Equity investors should look beyond the usual suspects these days This week marks the 100th day of President Trump’s current term in the White House.

What Happened Last Week Easing Fears: Equities rallied, led by the Mag 7, as tariffs, Powell firing fears, and DOGE-related cuts all eased. Positioning Snapback


Market participants have fled dollar-based assets, leading to dollar weakness The U.S. dollar has experienced a sharp decline this year through April 17, falling 9.8%

CHARLOTTE, NC (April 22, 2025) – Horizon Investments, LLC, a leader in providing the financial advisor community with highly customized investment and technology solutions, is

What Happened Last Week Yields Stabilized: Despite Trump’s consideration of firing Powell, 10-year yields declined, supported by several solid Treasury auctions. Equity Volatility Eased: Selling


Although uncertainty remains, perpetual market swings may be less frequent While still higher than what Wall Street would prefer, market volatility has trended lower this
Gain Strategies The first quarter was one of volatility and investor whiplash that felt much worse than it was, although the early April price action
What Happened Last Week Equities: The S&P 500 surged 5.7%, yet frequent trade policy reversals, weak confidence, and a lack of a major valuation discount

Short-Term Market Volatility Market volatility over the past week has been nothing short of historic. The two-day loss in the S&P 500 in the wake


What Happened Last Week Tariff Shock: Trump’s huge tariffs—a 10% baseline already in effect and the “reciprocal” tranche to be implemented on April 9—threaten a


The power of diversification has been on display throughout 2025 Headline after headline this week highlighted that stocks posted their worst quarterly return since 2022—with


Tariffs are taxes and taxes slow economic growth. The Trump administration’s newly announced tariff policy represents a ~$600 billion tax hike, roughly twice the size

What Happened Last Week Tariff Impact: Equity markets declined following Trump’s announcement of 25% auto sector tariffs, pushing U.S. tariffs to their highest level since

History suggests a rebound could be in order The market’s smaller stocks are down—and it may be time to pick some up. While the S&P
What Happened Last Week Equity Consolidation: Intra-equity market volatility was calmer last week after a few weeks of sharp investor rotations out of the U.S.


What Happened Last Week Market Correction Signals: S&P 500 falls for a fourth week—one of the quickest corrections in 75 years—as indices finish below key

Recent stock market losses are not as bad as they may seem Last week saw the S&P 500 have its worst week since September. The
What Happened Last Week U.S. Sell-Off: Weak investor sentiment drove the S&P 500 to its third weekly decline, while the NASDAQ 100 entered correction territory.


Join Scott Ladner, Chief Investment Officer, and Austin Fitch, CFA®, Head of Consulting Solutions on Monday, March 10 at 10:00 a.m. ET for an informative

Consumers may be tapping the brakes on their spending The outlook for the U.S. economy took a hit recently—and investors will be watching carefully to
The President Trump Seesaw: A Post-Inauguration Review of the Markets Over the last several weeks, President Trump’s White House and the Department of Government Efficiency
What Are Risk Management Strategies? Risk management strategies are systematic investment approaches to identifying, assessing, and mitigating potential risks while optimizing returns. These comprehensive strategies

Understanding Wealth Preservation Wealth preservation refers to protecting and maintaining your financial assets to ensure long-term stability and growth. This practice is important for minimizing
What Happened Last Week Sentiment Souring: Policy uncertainty is likely contributing to the deterioration in animal spirits. Slowdown Fears: Investor growth concerns were fueled in

The U.S. has been lagging Europe and China in recent months. It seems “America First” doesn’t apply to the financial markets these days, as several
What Happened Last Week Equity Sentiment Falls: S&P 500 hits new all-time highs but small-caps and retail darlings suffer big losses. International Outperformance: The string


Uncertainty is spiking, but optimism remains strong. The White House’s sweeping, and sometimes see-sawing, economic policy announcements on tariffs and other issues have a growing
What Happened Last Week Tariffs: Markets welcomed Trump’s tariff delay, but skepticism raises the risk of more aggressive action down the line. Markets: Optimism over

Earnings have been much better than expected thus far among the market’s small companies. Large-company stocks have outpaced their small-cap peers since the start of
What Happened Last Week Policy Uncertainty: Investors welcomed a delay in tariffs on Canada and Mexico. Sentiment Support: A weaker dollar, primarily driven by lower
What Are Goals-Based Retirement Portfolios? Goals-based retirement portfolios represent a differentiated approach to asset management that aligns investment strategies with an individual’s unique financial objectives
What is a Goals-Based Investment Manager? A goals-based investment manager typically creates and implements personalized investment solutions to address individual financial goals. Unlike a traditional
Understanding Goals-Driven Investing Goals-driven investing is a unique approach to asset management that places your personal financial objectives at the core of your investment strategy.
What is Goal-Based Investment Planning? Goal-based investment planning is a comprehensive approach to investment management that focuses on aligning investment strategies directly with specific, personalized
What is Goals-Based Asset Management? Goals-based asset management is a unique financial approach that aligns investment solutions with an individual’s financial objectives. Unlike traditional asset

New import taxes on China, while Mexico and Canada get a reprieve for now. The trade war has started—albeit with a smaller opening shot than

What Happened Last Week DeepSeek Dip: Tech stocks plunged due to fears of overinvestment in AI infrastructure following DeepSeek’s model release. Trump Tariffs: Tariff threats
What is a Goals-Based Investment Manager? A goals-based investment manager typically creates and implements personalized investment solutions to address individual financial goals. Unlike a traditional

What does Nvidia’s historic rout mean for investors? The bad news: AI darling Nvidia lost $593 billion in market capitalization on Monday—the single-greatest one-day plunge
What Happened Last Week Dollar Decline: The dollar had its worst week in a year as no “day one” tariffs from the Trump administration lifted

Will Trump’s tariffs push the greenback even higher? The U.S. dollar has risen sharply in value versus other world currencies in the past few months,

CHARLOTTE, NC (January 23, 2025) – Horizon Investments, LLC, a provider to the financial advisor community of customizable investment and technology solutions, announced that

What Happened Last Week Lower Rates: Downside inflation surprises in the U.S. and U.K. and dovish Fed comments fueled a move lower in Treasury yields.
Watch Now Mike Dickson sees early-year volatility as ‘normal’, with positive signs from CPI, retail sales, and broadening sector strength beyond tech. Head of Research

OVERVIEW Stocks posted mixed results during the fourth quarter of 2024. Investors were initially encouraged by positive economic news and an uncontested U.S. Presidential election,

Will the U.S. economy’s growth machine keep on humming? Surging bond yields are rattling investors, fueling concerns that stocks may face turbulence ahead, driven by


Watch Video As stocks dip and Treasury yields climb, CIO Scott Ladner remains cautiously optimistic. Unlike 2022, when inflation and interest rate hikes were the
Gain Strategies The choppy, volatile market environment continued in the final quarter of 2024. Still, in contrast to the prior quarter, global equities (MSCI
What Happened Last Week Global Selloff: Stocks fell as rising yields and rate uncertainty pressured equities. Economic Strength: Strong jobs data showed resilience, but “good

Watch Video Despite no significant changes in the economy, a shift in perspective has created market volatility and raised questions about the Fed’s outlook. Chief

Do top-heavy markets eventually spread out? Many investors have experienced extraordinary stock market gains over the past two years, with the S&P 500 up 26.3%
What Happened Last Week Santa Rally Fizzles: The S&P 500 closed the week ~2% below its levels before the Fed’s rate cut in mid-December. Holiday

What Happened Last Week Hawkish Cut: The Fed cut 25 bp and pointed to a pause in their cutting cycle in January; economic projections and

Watch Now During a recent interview with BNN Bloomberg, Zach Hill highlighted key themes for 2025, including corporate resilience, deregulation, and earnings growth. However, recent

Small-cap stocks may offer tactical opportunities. Investors who expect a late-year, post-election rally in small-company stocks may need to be patient. Historically, December has been
What Happened Last Week Equity Reprieve: U.S. large-cap gains paused last week despite a rally across the mega-cap growth complex led by AVGO. U.S. Inflation:

Watch Now Broadcom hits a record high after proving nay-sayers wrong. How will the custom chip creator finish out the year? Head of Research Mike

The digital currency seems to have the wind at its back these days. An ongoing post-election surge drove Bitcoin’s price above $100,000 for the first
What Happened Last Week Fresh All-Time High: S&P notches another ATH, supported by mega-caps. Price Action: A weaker dollar drove international stocks outperformance. Payrolls: Good,


Opportunities outside of the top performers. It’s no secret that a small number of stocks in the S&P 500 have been largely responsible for the
What Happened Last Week All-Time Highs: Both domestic large- and small-caps hit fresh all-time highs over the holiday-shortened trading week. Rates Lower: Treasury yields fell

What Happened Last Week Stocks Rose: S&P 500 closed within a hair of all-time highs on the back of easing growth concerns, Trump’s cabinet picks,

The latest homebuilder data could provide some promising signals for the housing market. Chief Investment Officer Scott Ladner visited BNN Bloomberg to discuss how potential

Positive earnings surprises are back on track. With more than 90% of the companies in the S&P 500 index reporting their earnings results, we now
CHARLOTTE, NC (November 19, 2024) – Horizon Investments, LLC, a leader in providing the financial advisor community with highly customized investment and technology solutions, today
Chief Investment Officer Scott Ladner dove into the key forces shaping today’s markets during a recent appearance on Schwab network. From the ongoing bond volatility
What Happened Last Week Price Action: Headline equities sold off as investors digested marginally hawkish Fed commentary and Trump’s cabinet picks. Controversial Cabinet Picks: RFK
While inflation remains sticky in areas like services and housing, Mike sees an opportunity to navigate this complexity. He spotlighted healthcare as a potential hidden

Recent election results bring a 2016 vibe back to the market, with U.S. stocks currently leading over internationals, but inflation concerns are real. Head of
What Happened Last Week Republican Election Sweep: Republicans granted a strong mandate to pursue an ambitious policy with Trump’s decisive victory, anticipated majorities in Congress,

Investors saw sharp market movement the day following the election Donald Trump and the Republicans outperformed expectations on Election Day, securing the White House and

Stocks have had a habit of gaining ground no matter who becomes President. Regardless of which candidate emerges victorious, historically, investors have generally come out
What Happened Last Week Yields Rose: Concerns over higher spending in the U.S. post-election caused yields to spike, dampening equity sentiment. Mega-cap Earnings: The NASDAQ
Inflation concerns, rather than growth expectations, could be behind the rise in 10-year yields, especially as prediction markets fluctuate with the election. Chief Investment Officer

Buyers need lower rates to get back in the game. In anticipation of the Fed’s rate cut last month, more would-be homebuyers applied for mortgages.

“We’re gaining on it.” The mega-cap growth to small-cap stock transition that is. A solid earnings outlook could solve recent small-caps underperformance relative to large-caps.

Chief Investment Scott Ladner joined BNN Bloomberg to discuss potential impacts of the U.S. election on markets.
What Happened Last Week Yields Pushed Higher: Talk of fiscal worries added to the existing upside momentum for U.S. yields. Stocks Sold Off: Global equities
Head of Research and Quantitative Strategies Mike Dickson joined Schwab Network to highlight the U.S.’s strong economic growth, with the Atlanta Fed’s GDP forecast at

Consumer spending, corporate earnings, and the overall economy remain robust. Investors will examine one of the last snapshots of the economy’s health before election day—and
What Happened Last Week New All-Time High: S&P 500 notches new all-time highs and posted gains for the sixth consecutive week. Price Action: Financials, value,
We think a “barbell approach” combining both sectors and ETFs may be beneficial to balance risk and capture opportunities as AI advances drug development and

OVERVIEW Stocks posted another quarter of positive returns — despite some significant volatility along the way—with several equity market indices recording a string of record
“We’re looking under the hood of the micro,” says Horizon Investments’ Zach Hill. He looks at how earnings season is proving to show continued resilience

The stock market is two years (and counting) into a bull market. Last Saturday marked the second anniversary of the current bull market for stocks.
What Happened Last Week Price Action: Fresh all-time highs in U.S. large caps on bank earnings and re-kindling of the AI narrative. Uncertainty: Market rallied
Gain Strategies Despite returns of over 5% for both global stocks (MSCI All Country World Index) and core bonds (Bloomberg US Aggregate Index), the

Lowest spreads in nearly three years Want more evidence that the U.S. economy is in good shape? Just take a look at the junk bond

Chief Investment Officer Scott Ladner and Head of Consulting Solutions Austin Fitch, CFA®, review the third quarter of 2024 and provide a market outlook. Download

Chief Investment Officer Scott Ladner joined BNN Bloomberg for a wide-ranging conversation on the post-COVID economic landscape, the growing significance of AI, and the potential
What Happened Last Week Geopolitical Volatility: Oil soared over 9% as investors weighed Israeli retaliation against Iran’s energy infrastructure. U.S. Jobs: A blow-out jobs figure

It’s been 17 years since we’ve seen a weekly return this strong Long-suffering Chinese stocks broke out of their doldrums last week following the announcement
How do you harness the resilience of the U.S. consumer? With steady wage gains and relatively low debt levels, consumer spending remains a key factor
During a recent conversation with Schwab Network, Chief Investment Officer Scott Ladner highlighted three key sectors to watch in the months ahead: Technology (boosted by
With recent Chinese stimulus measures stirring excitement in the markets, it’s easy to get caught up in the buzz. However, as Scott Ladner, our Chief
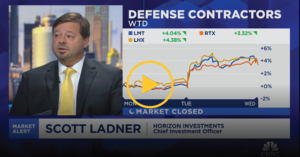
Defensive stocks have come into focus as global tensions have risen in recent weeks – particularly in the Middle East. With elections around the corner
What Happened Last Week China: Property market support was announced over the weekend in major cities in addition to the raft of monetary and fiscal

Which sector has been leading the rally so far in 2024? One market sector has outperformed all others so far this year—and it’s probably not
What Happened Last Week Fed: Equities rallied as the Fed cut 50 bps to kick off its rate-cutting cycle, guiding for further rate decreases down

https://www.youtube.com/watch?v=-f7S0cz_D-4&t=95s We remain bullish on equities, anticipating that continued support from the Fed will drive markets higher as we close out the year. Head of

What Happened? The Federal Reserve (Fed) started their much-awaited easing cycle on Wednesday after holding their target rate in the 5.25-5.50% range since last July.

Are you ready? All eyes are on Jerome Powell on Wednesday as investors await the Federal Reserve Board’s near-certain decision to cut the federal funds
What happened last week Stocks Rebound: U.S. large caps posted their best week of the year, up about 4% and mostly reversing the worst week

Successful investing doesn’t have to be a thrill ride. Anyone who has driven California’s Pacific Coast Highway or North Carolina and Tennessee’s Tail of the

Election Season: A Time for Ballots, Not Drastic Portfolio Changes When major elections are near, investors may be concerned about how their portfolios will be

September holds its notorious history of challenging stocks. How could interest rate cuts affect the market’s response? Chief Investment Officer Scott Ladner joins BNN Bloomberg
Regardless of stabilized delinquency rates and healthy debt-to-income ratios, consumers do not believe this is a good economy. Chief Investment Officer Scott Ladner joins Fox
What happened last week Price Action: Poor September seasonality may be to blame for a more than 4% decline in U.S. large caps. AI Woes:
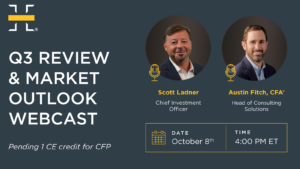
Join us at 4:00 PM ET on Tuesday, October 8, 2024, for Horizon’s Quarterly Webcast, hosted by Chief Investment Officer Scott Ladner and Head of

Here’s how stocks may perform for the rest of 2024 As the fall harvest season begins, it’s a time of reaping the rewards of hard
Despite Nvida’s recent slump, the market kept moving. Chief Investment Officer Scott Ladner joins Schwab Network to discuss a shift in focus to the broadening
What happened last week NVDA: Nvidia’s (NVDA) beat and raise was not enough to impress investors, resulting in a nearly double-digit sell-off. Strong Data: Second
Watch out above. Here comes revenue per employee. Chief Investment Officer Scott Ladner joins CNBC to discuss how the adoption of AI moves the market.

Fed Chair Powell tees up the long-awaited rate cut Fed Chair Powell said just about everything investors wanted to hear during his Jackson Hole, Wyoming
What happened last week Powell Pivot: Chair Powell validated the market’s view that a rate cut is coming in September. Markets Rally: Investors took comfort
Conventional economic thinking may not have a place in today’s market cycle. Head of Portfolio Management Zach Hill, CFA®, joins Schwab Network to discuss the

Best week of 2024 for the S&P 500 After a brief summer slump and a short-lived overreaction, stocks enjoyed their best week since November, up
What happened last week Market Recovery: S&P rallies to within 2% of its all-time high. Healthy Data: Strong retail sales, good guidance from Walmart, and
Homebuilders and housing stocks may be a smart first play for the anticipated September cut by the Fed. Chief Investment Officer Scott Ladner joins Schwab

U.S. company profits continue to impress. Earnings season is in the home stretch, with more than 90% of the companies in the S&P 500 index
What happened last week Price Action: U.S. and global stocks ended the week practically unchanged despite Monday’s historic volatility. Carry & Dispersion Trades: Unwinds in

Slower numbers do not necessarily mean weak numbers. Chief Investment Officer Scott Ladner joins BNN Bloomberg to discuss the recent U.S. jobs report and his

The markets have shown remarkable resilience, rebounding from last Monday’s sell-off. But is it time to feel confident? While the panic we witnessed last week
The S&P 500 fell 3% on Monday—its biggest one-day decline in nearly two years—amid growing fears that July’s slowdown in hiring could spark a recession.

Market volatility spikes—but how much should you worry about it? The first full week of August started with a bang: The S&P 500 dropped 3%
What happened last week Price action: Summer liquidity, poor economic data, a less dovish than desired Fed, and positioning all contributed to a broad-based decline
The recent market volatility should prompt investors to take a deep breath and evaluate their investment time horizon. Chief Investment Office Scott Ladner joined Yahoo

A growing number of stocks are having their moment in the sun Everybody loves a good comeback story: Seabiscuit. The Mighty Ducks. 493 stocks in
What happened last week Price Action: Small-caps continued to outperform year-to-date leaders, like the tech-heavy NASDAQ 100. U.S. Data: U.S. GDP came in stronger than

Don’t read too much into harbingers of stock market doom and gloom Sometimes, it pays—literally—to look beyond what’s “obvious” to everyone else. Case in point:
What happened last week Equity Market Reversion: Small-caps outperformed mega-cap technology by a little less than 6% as year-to-date laggards continued their string of outperformance.

Overview Overall, stocks delivered another quarter of strong gains during the three-month period ending June 28, 2024. For the quarter: The Nasdaq 100 returned 8.1%.

Will softness in housing inflation, jobs, and other metrics prompt the Fed to act soon? Those long-sought-after Fed rate cuts are looking more plausible, thanks
What happened last week Softening Economic Data: Cooler than expected inflation data weighed on interest rates; September rate cut now the base case. Equity Markets
Gain Strategies Global stocks continued their upward march in the second quarter, powered higher by continued economic resilience and investor enthusiasm around the AI-theme.

Chief Investment Officer Scott Ladner and Head of Consulting Solutions Austin Fitch, CFA®, review the second quarter of 2024 and provide a market outlook. Download
What happened last week Price Action: MAG-7 leads U.S. equity indices to fresh all-time highs as small-caps and large-cap value decline. Softening Economic Data: Unemployment
Will we see broader market growth beyond the tech giants? Head of Portfolio Management Zach Hill, CFA®, provided insights on the S&P 500’s performance and the

Will the next round of AI earnings be impressive – or lackluster? Chief Investment Officer Scott Ladner joined CNBC to forecast his expectations on where

Six more months! Six more months! Investors cheered as stocks ended the second quarter last Friday up 4.3%. . . and 15.3% for the first
What happened last week Reversion Price Action: Year-to-date equity trends continued their reversal last week; small caps and internationals led U.S. mega-cap technology. U.S. Debate:

Is the seventh month of the year a stock investor’s best friend? While scorching temperatures continue to sweep across much of the country, equity investors
What happened last week AI vs. the Rest: Year-to-date equity trends reversed last week as small-caps led mega-cap tech; quarter/month-end and specific product rebalancing flows

Head of Portfolio Management Zach Hill, CFA®, joins BNN Bloomberg to share our thoughts on the AI trade trajectory and why investors are underweight financials.
Would a September rate cut be a political move? Chief Investment Officer Scott Ladner joined Schwab Network to discuss potential motivators for the timing of

Are there potential opportunities beyond the handful of big stock market winners? The equity market has spent the better part of 2024 notching a series
What happened last week All-Time Equity Highs: Another week of new highs for U.S. large-caps as Broadcom, Oracle, and Adobe earnings show AI-driven upside fundamental
Are we in for a slow summer with the Fed? Head of Portfolio Management Zach Hill, CFA®, joins Schwab Network to discuss what fewer Fed

Falling bond market volatility could support equity prices. Investors looking for signs of what stocks may do next often turn to the bond market for
What happened last week AI Theme: NVIDIA (NVDA) rally to $3T in market capitalization vaults U.S. large caps to fresh all-time highs. Strong Payrolls Data:

Potential homebuyers are hitting the brakes. What could that mean for the future? Would-be homebuyers are increasingly deciding to stay put —which could help further
What happened last week Revenge of the Meme Traders: Small-caps outperformed large-caps on resurgent trading in “meme-stocks.” Slightly Softer U.S. Data: 1Q U.S. GDP was

Thanks to AI, it seems a bunch of people want Nvidia’s semiconductors. Is it Nvidia’s world and we’re just living in it? At least, that’s

With GDP and inflation slowing, keep in mind our strong starting place. Chief Investment Officer Scott Ladner joins Fox Business Mornings With Maria to discuss
What happened last week Semis: NVDA’s “beat and raise” earnings report reignited the AI trade and propelled mega-cap tech to fresh all-time highs. Hawkish Fedspeak:
Where do you go from yesterday’s Fed-induced sell-off? CIO Scott Ladner joins CNBC Worldwide Exchange to discuss how he would play the markets. Watch Video

Should investors consider opportunities in global stocks? We believe international stocks could deserve a place in many investors’ portfolios because they can potentially add diversification
Utilities are the top performing sector this quarter. Is this the next AI play? Chief Investment Officer Scott Ladner joins Fox Business The Claman countdown
What happened last week Price action: China led on a green week for global stocks, ratcheting higher as Chinese policy support continues to improve the

Are U.S. consumers ready to go more rounds? “When will the consumer finally crack?” is a question that seems to be on more investors’ minds
Finding a balance between growth potential and low-risk investments can be essential for long-term retirement income. Head of Research & Quantitative Strategies Mike Dickson, Ph.D.,
What happened last week Price action: The S&P 500 rose higher and through key technical levels, recovering the majority of April’s losses. Interest Rates: Ahead

Generating goals-based income with an equity-centric, globally diversified portfolio. Memo to retirees seeking sustainable spending power: Consider sticking with stocks. One of our core beliefs
https://www.youtube.com/watch?v=K_2CoH-Ju1o&t=8234s%20 Chief Investment Officer Scott Ladner joins Bloomberg to discuss large vs small business confidence. Watch Video
Is the Fed out of play as a market catalyst at this point? Chief Investment Officer Scott Ladner joins Yahoo! Finance on Market Domination to
What happened last week Earnings: Strong earnings from AI-exposed mega-cap technology supported a modest rally in US equities. Jobs report: The labor market remains strong

It’s a big week for news from corporate America. Earnings season is in full bloom, with roughly half of the companies in the S&P 500

OVERVIEW Stocks during the first quarter of 2024 extended the rally that began late last year, with major market indices frequently hitting new highs during
What happened last week Stocks rose for the first time in four weeks on the back of strong earnings. Economic data was weak, with GDP

Middle East conflicts shouldn’t derail the strong domestic growth story. Rising Middle East tensions caused oil prices to briefly spike last week before reversing course
What happened last week Equities fell for the third consecutive week as rates continued to climb higher. Strong retail sales print supported the trend of
Chief Investment Officer Scott Ladner joins Mornings With Maria on Fox Business to analyze this week’s earnings, recession probability, and Fed decision impacts on inflation.
Chief Investment Officer Scott Ladner breaks down the chips and the materials and energy sectors on Fox Business Network ‘The Claman Countdown.’ Watch Video

Can economic growth tailwinds outweigh higher interest rates? Month-over-month retail sales for March topped economist expectations at 0.7%, with February figures revised higher to 0.9%
What happened last week Equities sank as the 10-year Treasury yield surged above 4.5%. Third consecutive upside CPI surprise pushed rate cuts out of market
Chief Investment Officer Scott Ladner and Head of Consulting Solutions Austin Fitch, CFA®, review the first quarter of 2024 and provide a market outlook. Download

Head of Research & Quantitative Strategies Mike Dickson, Ph.D, joins BNN Bloomberg to discuss pivoting from planning for nearly seven rate cuts to less than
Gain Strategies Global stocks put in another strong quarter to start 2024 as continued economic upside surprises, especially in the U.S. and falling bond

Can company profits exceed rising expectations? First quarter 2024 earnings season kicks off this week, on the heels of reports showing both a robust jobs
What happened last week The second quarter opened with a whimper as stocks declined and the U.S. Treasury yield curve bear steepened. Strong economic data,

First-quarter returns suggest the market may have more to give. Stocks went out like a lion in March, with the S&P 500 hitting its 22nd
What happened last week Holiday-shortened week ends 1Q 2024 – U.S. equities (S&P 500) rose over 10%, a strong (85 percentile since 1993) historical quarterly

Accelerating inflation and long-term growth have tilted the balance in favor of the hawks. Head of Portfolio Management Zach Hill, CFA®, Joins Schwab Network to

Derivatives can be effective when you know what you’re buying or selling. Covered call option strategies can be an innovative and potentially impactful way to
What happened last week Dovish central bank policy meetings resulted in fresh S&P 500 all-time highs. Market leadership in the U.S.’s largecap growth extended last

Keeping a close eye on Treasury market volatility Volatility in the Treasury bond market is once again flirting with its recent lows. That could be
What happened last week Last week’s price action was choppy and lacked a cogent narrative. 10-year U.S. Treasury yields rose by their most since last

Taking a tactical approach to “junk” bonds Yield-hungry investors eyeing an eventual Fed rate cut are moving into high-yield corporate bonds thesedays, a show of
What happened last week Mega-cap tech underperformed the broad market and equal-weight indices as market breadth improved. The underperformance of mega-cap tech is likely short-term

Head of Research & Product Development Mike Dickson, Ph.D., joins Schwab Network to discuss his expectations of Fed rate cuts, investing in a high rate,

Prices of many services are heating up again. Last week, we learned that the Fed’s preferred inflation gauge—the core personal consumption expenditures(PCE) price index—rose by
The market has done well in the face of repricing to half of their initial projected Fed cuts this year. CIO Scott Ladner joins Fox

We expect market broadening within the S&P rather than small or mid-caps. Chief Investment Officer Scott Ladner joins CNBC to discuss what’s ahead for the
What happened last week Stocks rose as mega-cap tech and theAI theme continued to propel equitymarkets to new all-time highs. Retail speculation and flow into

Eventually, many clients will rely on the nest egg they have accumulated and preserved to address their financial needs during what may be a lengthy

Do shares of non-U.S. companies deserve a place in your portfolio? With soaring U.S. stocks—and domestic tech stocks in particular—capturing the headlines these days, it’s
What happened last week Nvidia, now a $2 trillion market-cap company, crushed lofty earnings expectations and sent equities to all-time highs. China’s equity performance picked
What happened last week Hot inflation print pushed back the start of rate cuts; more importantly, longer-term interest rate expectations drifted higher, weighing on equities.

Is stocks’ extended winning streak “an offer you can’t refuse”? The S&P 500 has now closed higher for 14 out of the last 15 weeks.

Zach reviews the 4Q23 earnings season, what Horizon anticipates from the Fed and interest rates this year, and how these top-of-mind components translate into portfolio
What happened last week A mega-cap-led rally lifted the S&P 500 above 5,000, a new all-time high. Interest rates continued to drift higher as the
Earnings momentum, disinflation, and a global easing cycle… is the US an attractive place to invest? Chief Investment Officer

Robust consumer spending continues to support a strong economy. Last week’s impressive jobs data—employers added 353,000 new jobs in January, nearly double the expected amount—had
Chief Investment Officer Scott Ladner joins Gregg Greenberg with InvestmentNews to share how Horizon’s goals-based investment management differs from traditional investing. Watch Video
What happened last week Stocks ended the week higher on a mix of very strong AI-driven mega-cap earnings and a large upside surprise to January

The economy and inflation are lining up as investors hoped they would. All eyes were on the Fed this week as it held its first
What happened last week Economic growth remains hot with inflation cooling – the probability of a ‘soft landing’ or ‘no landing’ is increasing. The strong

It could be a great time to buy stocks. Here’s why. Investors celebrated last Friday as the S&P 500 notched its first record-high close in

Until bazooka-style fiscal government spending is announced, we don’t see China as an attractive investment. Chief Investment Officer Scott Ladner joins Bloomberg Radio to discuss

Navigating heightened market volatility and an evolving regulatory landscape has become the new normal for many financial advisors, all while managing the operational and administrative
A broader tech. trade could be the largest driver in 2024 as the market moves from hardware technology to the services part of the AI
China would need massive fiscal spending to get out of its balance sheet recession and become a wise investment. Chief Investment Officer Scott Ladner

We appear to be in a war-recovery-like period, going through an abrupt normalization process, which we think should lead central banks, especially the Fed, to
What happened last week Action-packed and holiday-shortened trading week underscored by new all-time highs across major US equity indices. Economic data fueled the rally –

“Sticky” shelter costs could keep overall prices uncomfortably high. While inflation’s steady march downward of late has investors (and the Fed) cheering, it may be
While some headlines focus on credit card debt alone, Head of Research & Product Development Mike Dickson, Ph.D., provides a different perspective on how the
What happened last week Magnificent-7 (“MAG-7”) mega-caps led the “broadening-out” trades’ outperformers (e.g. small caps). Benign December CPI & PPI prints contributed to a dip

OVERVIEW Following a third-quarter slump, stocks roared back to life during the final three months of 2023. The S&P 500 index of large-company stocks rallied
Gain Strategies In a topsy-turvy year for investors and economists alike, 2023 ended on a high note with strong rallies across equities and fixed income.

Value and growth index fund investors may be surprised by their returns last year. Investors commonly own both value and growth stocks to diversify their

Chief Investment Officer Scott Ladner and Head of Consulting Solutions Austin Fitch review the fourth quarter of 2023 and provide a market outlook. Download Presentation
What happened last week The S&P 500 snaps its 9-week winning streak to end Friday less than 3% from all-time highs. Rates moved higher across

“This Covid cycle that we’ve just been through was not a traditional business cycle. It never has been.” CIO Scott Ladner joins Fox Business to
What happened last week 2023 set a high bar for 2024 market-wise, although new all-time highs are just a hair away from last week’s closing

REGISTER NOW Join Horizon’s Focus Webcast, hosted by Chief Investment Officer Scott Ladner and Head of Consulting Solutions Austin Fitch, CFA®, for a review of

How are the “Magnificent 7” stocks really doing? Outperformance isn’t always exactly what it seems to be. Many investors this year have been hungrily eyeing
What happened last week Last week was a full macro week with a string of positive surprises that drove a bid to risk assets. Consumer

Some crucial context on Americans’ “out of control” debt levels. “Credit Card Debt Crisis” “Credit Card Debt Hits New Record” “Americans Are Drowning in Credit-Card
What happened last week The S&P 500 has rallied for its sixth straight week, retracing back to 1Q ‘22 levels. Small-caps and other higher beta

Most stocks have been laggards this year, but that could be starting to change. It’s no secret that a minute group of tech stocks has
What happened last week A strong seasonal rally is in full swing as the S&P 500 posted its best month since July 2022. The rally
Chief Investment Officer Scott Ladner discusses his outlook for markets and investment strategy. Watch Video

Will December bring glad tidings to small-company stocks? Small-cap stocks have had quite the slog this year. Punished by rising interest rates and lingering fears

Baby boomers have been approaching retirement for a decade, bringing billions of dollars out of retirement accounts as America’s second-largest generation approaches the IRS’s required
What happened last week A short trading week saw the S&P 500 inch toward an all-time high. Short covering starts to narrow the dispersion between

Chief Investment Officer Scott Ladner joins CNBC to discuss the divergence in stock performance between small-cap and large-cap companies. Watch Video

One active approach to risk management is currently beating the market. Risk management can be an important component of goals-based planning. Used well, it has

Chief Investment Officer Scott Ladner joins Fox Business ‘The Claman Countdown’ to provide investing advice. Watch Video This is not investment advice or a recommendation

Scott Ladner joins BNN Bloomberg to discuss the U.S. markets, and Powell’s recent comments on raising rates. Watch Video
What happened last week Risk sentiment increased last week, lifting the S&P 500 through key technical levels as Treasury yields plummeted. Bullish price action was

The end of Fed rate hikes suggests good things for equities. The stock market’s surge last week—U.S. and global equities soared nearly 6%—may be the
What happened last week Risk sentiment increased last week, lifting the S&P 500 through key technical levels as Treasury yields plummeted. Bullish price action was

Three years of less-than-stellar financial market performance. It’s been a tough slog for investors over roughly the past three years, with most corners of the

MASTERCLASS: Portfolio Construction The portfolio construction process can be broken down into a series of important decisions, including asset allocation, manager due diligence, and more.
What happened last week Investors reduced market exposure due to geopolitical tensions weighing on equities for the second week in a row. The relative stability

GDP growth over the past three months may have been huuuuuge. Third-quarter GDP growth could be a monster. True, it’ll be a few weeks before

House hunters are facing a shocking number these days. Pity today’s homebuyers who are looking at an average monthly mortgage payment just shy of $2,900.

OVERVIEW During the third quarter of 2023, investors hit “pause” on the rally that had lifted stocks higher for much of the year. The major
What happened last week Stocks and bonds sold off as geopolitical tensions outweighed strong economic and fundamental data. Long-end Treasury yields surged, sending the S&P
Bond market must get ‘under control’ before stocks rise again. Chief Investment Officer Scott Ladner predicts ‘problems’ with small and mid-capital businesses amid high Fed
Gain Strategies After a surprising and surprisingly positive first half of the year for financial markets, the recovery from the challenging market conditions of 2022
What happened last week Stocks close the week higher despite mounting geopolitical concerns and rising long-term interest rates. Bond market volatility driven by the Middle
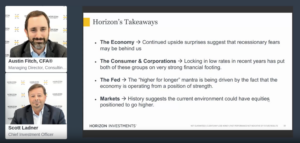
https://www.horizoninvestments.com/wp-content/uploads/2023/10/Q3-Webcast-Super-TB-Small_1.mp4 Chief Investment Officer Scott Ladner and Managing Director of Consulting Solutions Austin Fitch review the third quarter of 2023 and provide a market outlook.
What happened last week Stronger economic data and domestic political turmoil contributed to a resumption of the bond sell-off. Stocks reversed early weakness as a

It’s been bleak days—and lots of them—for bond investors. As the fourth quarter begins, bonds are on track for a third consecutive calendar year of

Look Outside of the Stocks that Gained from the Inflation Trade The staples companies were not hurt on the input side of the inflation equation,

Over the summer months, Horizon conducted the firm’s first annual Advisor Sentiment Survey to gauge opinions and expectations around the current market, interest rates, asset
What happened last week Last week, the quarter ended with both stocks and bonds mainly in the red. Long-end Treasury yields once again surged to

The greenback’s recent rally could have legs. The U.S. dollar is lighting up the charts, rallying for the past ten weeks (see the chart). That’s
What happened last week A more hawkish than expected Fed meeting saw higher interest rate projections in 2024 and beyond. The long end of the

Next-generation investing in AI will take hold in 2024 CIO Scott Ladner joined BNN Bloomberg to discuss the upside in markets, cyclical commodities, Japan’s corporate

Falling interest rate volatility in Treasuries could herald a stock market rally. There are few things that make investors happier than having clarity about where

https://youtu.be/mWhUrUv0Ffo?feature=shared Hear Zach cover what Horizon is taking from recent economic data, our expectations for Fed and monetary policy, and our positioning across equities and
What happened last week Treasury yields continued to move last week higher on strong economic data. U.S. inflation came in slightly hotter than expected, driven

Sharply higher oil prices have the potential to re-ignite inflation. Last week saw oil prices hitting their highest point in 10 months following news that
What happened last week Strong data drove Treasury yields higher and stocks lower in a holiday-shortened trading week. As China signals iPhone bans, $200B of

Historically, the 9th month of the year hasn’t been kind to investors. “April is the cruelest month,” wrote poet T.S. Eliot—who, we assume, didn’t own
What happened last week It was a recovery week for equities as yield moves continued to dictate price action. Labor market data was good news
What happened last week A choppy week in markets saw small recoveries for stocks and bonds. Fed Chair Jerome Powell endorsed a data-dependent message at
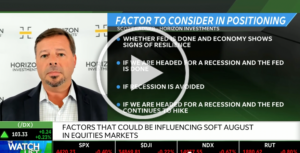
CIO Scott Ladner joined Schwab Network to discuss recent employment and inflation data, factors behind soft August, and artificial intelligence.

There are few signs of the economic struggles predicted at Jackson Hole last year. Attention will be focused on Wyoming this week, where the 46th
What happened last week The push higher in Treasury yields drove the third consecutive week of simultaneous losses in equities and core bonds. Retail sales

Stock investors may want to brace for some bumps in the road. After months of gains and low volatility from stocks, emerging signs show that
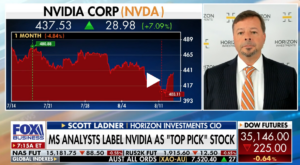
Chief Investment Officer Scott Ladner joined Fox News to provide critical tips to investors on ‘Mornings with Maria.’
What happened last week Pressure building on the disinflation narrative as global bond yields surge and commodities continue their rally Domestic equities were also lower

What happened last week Negative bond market developments likely drove the sell-off in equities Jobs report pointed to easing wage growth, indicative of progress towards
https://youtu.be/e26Kr8v2gvg Head of Portfolio Management Zach Hill, CFA® covered why the Fed matters less today, takeaways from earnings season, and under-the-radar macro themes we are

CIO Scott Ladner joined Yahoo! Finance to discuss portfolio positioning and how to prepare for the Fed.

Other market sectors are showing signs of life. The S&P 500 continued its winning streak in July and is up more than 20% in 2023.

What happened last week Stocks climbed as the Fed and European Central Bank (ECB) raised rates to 22-year highs Continued string of strong US data

Is the Fed’s battle to contain inflation finally done? The market seems to think so. Recent comments from multiple Wall Street firms and economists suggest
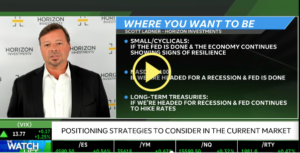
CIO Scott Ladner joined TD Ameritrade to discuss this week’s FOMC meeting and A.I.’s potential impact on sectors.
What happened last week Global stocks edge higher, led by the US, in a week characterized by slow and sluggish summer sessions Regional banks rallied,
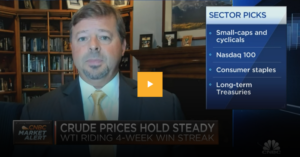
Chief Investment Officer Scott Ladner joined CNBC to discuss what’s ahead for the busiest week of the summer on Wall Street.

The S&P 500’s lowest correlation level in years suggests outperformers and underperformers should emerge. Think the S&P 500’s low volatility these days means all is

When was the last time a client asked, “What was my portfolio’s alpha?” You may encounter that question with institutions and sophisticated clients, but more

OVERVIEW During the second quarter of 2023, several key equity market indices built on their gains from the prior three months (see Exhibit 1). For
https://youtu.be/etvuMLvXBAM Chief Investment Officer Scott Ladner and Managing Director of Consulting Solutions Austin Fitch review the second quarter of 2023 and provide a market outlook.
Gain Strategies After a furious and volatile start to the year for stock and bond markets, the second quarter provided a welcome respite for investors

Will six months of returns cause you to forsake global diversification? While it’s true that “the market” is up for the year, it’s really a
What happened last week Equities sold off in volatile trading to start the third quarter Continued economic resilience drove Treasury yields higher and weighed on
Horizon Investments chief investment officer Scott Ladner analyzes the market as it enters the second half of 2023. Read Article
What happened last week Strong end to a strong quarter with the S&P 500 closing at its highest level since last April Global yields rose

Stock market volatility has fallen to multi-year lows? “Merrily, we roll along, roll along.” Those Stephen Sondheim lyrics pretty much summarize the sentiment among a
What happened last week Stocks sold off with small caps, value, and internationals leading losses as narrow market leadership continued Monetary policy developments were negative

Zachary Hill, CFA, joins ‘Squawk Box’ to discuss the latest market trends, whether stocks are due for a correction, and more. Watch Now

With the oldest baby boomers over eleven years into retirement and the oldest Generation X members just eight years away, we now have over 135

The housing market is the latest economic indicator to light up the charts? One of the key leading indicators of future economic activity—construction of new
What happened last week Increasingly positive investor sentiment boosted the S&P 500 closer to all-time high levels Fed delivers “hawkish pause,” signaling a hike in

Does This Market Have Staying Power? Stocks escaped the bear’s grip. What comes next Investors cheered last week as the S&P 500 broke free of
What happened last week It was a quiet week, with recent trends reversing in favor of year-to-date underperformers like small-caps and Chinese equities. Technical factors

The positive surprises in the labor market just keep on coming. Job creation in the U.S. continues to defy expectations. Case in point: last week’s
What happened last week Friday’s strong labor market data defined the trading week. A bipartisan debt ceiling bill averted the tail default scenario, suspending the
A.I. could be the most important productivity-enhancing development for the global economy since the uptake of the internet, notes Chief Investment Officer Scott Ladner. Watch

Is the fast-moving market moving too fast? Technology stocks generally hate higher interest rates. Tech companies often need ongoing access to lots of capital to
What happened last week A debt ceiling agreement was reached, and will likely become law this week. NVIDIA earnings were released and the results offer

CIO Scott Ladner, and Managing Director Austin Fitch, CFA® discuss the debt ceiling debate, disinflation, equity allocations, and the current market environment. https://youtu.be/Sjn6C0NsP9g

Active management aims to navigate trends as they emerge—and fade We believe an active, dynamic approach to portfolio management can provide investors the potential to
What happened last week The market saw year-to-date highs in stocks despite a lack of progress on the debt ceiling negotiations in Washington. Hawkish Fed

Apple is once again worth more than the entire Russell 2000 In Marvel movies, it’s common for one superhero to be bigger than an entire

Fear-inducing headlines are likely painting too grim of a picture. Silicon Valley Bank. Signature. First Republic. PacWest. Comerica. The list of regional banks that have

Hear Zach Hill, CFA®, cover earnings season, Fed policy, and what Horizon is watching in the markets. https://youtu.be/27YkbeBM_yc

Investors seem to be a relatively calm, cool, and collected bunch these days—which may be a harbinger of stock market strength in the coming months.

Overview The idea that the financial markets “climb a wall of worry” by showing resilience in the face of significant challenges was fully displayed during

Identifying investment opportunities may take a sharper focus going forward Fears about banks’ financial health have dominated many investors’ thoughts for weeks. But as we
Gain Strategies Investors shifted among dominant themes numerous times in what was a volatile but generally positive first quarter of the new year for equities

What tools can investors use to fight longevity risk in retirement? Many retirees today probably remember the 1976 disco hit “Right Back Where We Started
There’s tech, and there’s the rest Investors in tech stocks these days are a wildly happy bunch. Everybody else? Not so much. The gap between

Key Takeaways Investors require different outcomes from their investments, a one-size-fits-all passive approach is unlikely to work for everyone. Horizon believes tactical strategies can offer

Here’s something we have only seen once in 20 years In a true study of contrasts, the tech-heavy Nasdaq 100 index has soared 6.3% during
Scott Ladner and Austin Fitch discuss the Fed announcement and the current market and what they are watching.

Stocks stand to benefit if the Fed eases up on the brakes Continued concerns about the health of the U.S. banking system and economy have

Bank woes raise questions about the Fed’s next move. Investors’ sudden hunger for U.S. government bonds has pushed yields to their lowest levels in months—and created

Chip stocks have come out swinging to start 2023 In what could be a harbinger of things to come for the markets, semiconductor stocks are

The U.S. real estate market has been flexing its muscles in recent weeks. Unexpected strength in the real estate market this week is the latest
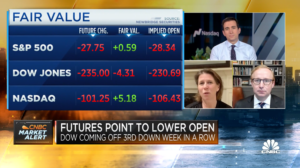
“The U.S. economy looks pretty strong, and we think that will feed into corporate profits.” – Zach Hill, Head of Portfolio Management

U.S. stocks have clearly perked up so far this year. But now, two key market metrics show a heightened level of risk in domestic equities

https://www.horizoninvestments.com/wp-content/uploads/2023/02/Fast-Take-Final-Video.mp4 Hear Zach Hill, CFA®, Head of Portfolio Management, cover Horizon’s thoughts on the state of the economy, Fed policy, equities and fixed income.

In the consumer market, high-quality products are identified as reliable, longer lasting, and are generally viewed very positively. Names of iconic brands receive instant recognition,

In the wake of a bruising 2022, investors seem to have decided that “risk on” is where it’s at this year. Case in point: High-beta

Expected interest rate volatility has fallen 28 points so far this year The financial markets are predicting less volatility in interest rates during the coming
Gain Strategies The final quarter of what has been a difficult year for asset owners finished on a positive note as both global stocks (MSCI

Overview Financial markets suffered sizable—in some cases, historic—losses in 2022. Soaring inflation combined with an aggressive monetary policy response by the Federal Reserve Board created

Investors eye foreign markets and like what they see. For more than a decade, international stocks have lost performance race after performance race to the

Put “protection” has come up short lately—but there’s a better way. Put options are often a go-to risk management strategy among investors seeking protection against


Up is down, and down is up Two key components of the equity market—growth stocks and value stocks—are looking significantly different as 2023 gets underway,

Hear Scott talk about areas of the market to watch in 2023, and his expectations for after inflation has cooled. WATCH VIDEO

Scott provides insight on the state of the market.
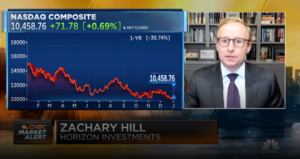

“For tech and communication services, there was this belief that those revenue streams were impervious to the ups and downs of the economy” READ FULL

Ladner: We think there will be a lot of tailwinds for the markets in the back half of next year. WATCH NOW

https://www.horizoninvestments.com/wp-content/uploads/2022/12/Zach-Hill-V5.mp4 Hear Zach Hill, CFA®, Head of Portfolio Management, cover Horizon’s thoughts on what’s ahead in 2023 for Fed policy, the run in value stocks

This year we have seen a first for stocks and bonds. Welcome to uncharted territory. As we head to the finish line, stocks are down

Zach Hill, CFA® discusses concerns around markets and the economy in 2023 on Mornings with Maria. WATCH NOW

Everybody can appreciate a smooth ride—and for investors, a journey without too many bumps along the way can potentially result in more wealth. One

Throughout 2022, investors have seen various positive economic developments as signs that the Federal Reserve Board was ready to pivot and end—or considerably scale back—its

Scott Ladner recently appeared on ‘Mornings with Maria’ with Fox Business to review inflation, the job market, interest rates, and more. WATCH NOW
Zach Hill, CFA® joined Nicole Petallides on TD Ameritrade Network to discuss the takeaways from the jobs report that came out on December 2nd. WATCH

Could bond investors find the next few months to be “the most wonderful time of the year?” High-yield (or “junk”) bonds—along with the rest of
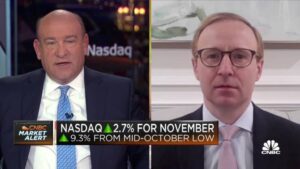
Horizon’s Head of Portfolio Management, Zach Hill, CFA®, joined Squawk Box Friday to discuss the inflation trade, expectations for this week’s Fed meeting, and his

https://www.horizoninvestments.com/wp-content/uploads/2022/11/Zach-Hill-Fast-Take-FInal-Video.mp4 Hear Horizon’s thoughts on quarterly earnings, Fed policy, and market outlook. Disclosure: The commentary in this report is not a complete analysis of every

Investors won’t have to dip into their savings to pay for their Thanksgiving feasts this year, but they may choke on their pumpkin pie when they

Investors are shifting gears in the wake of good inflation news. Will it last? The tide is turning—maybe. Following last week’s news of lower-than-expected inflation,

“The market is – as it has been a few times this year – very eager to trade a ‘Fed pivot’ … but we think

The losers of the past are riding high—while yesterday’s winners appear to be out of gas. To sail to your destination, you need to put

CIO Scott Ladner joined Yahoo Finance Live to discuss Fed policy and inflation, economic data, and overall volatility. Watch the Video

We’re more than halfway through the third-quarter earnings season, and thus far, the S&P 500 overall is reporting its worst year-over-year earnings growth since the third
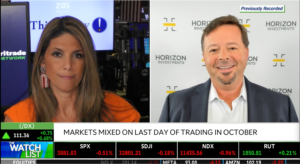
Scott Ladner joined Nicole Petallides on TD Ameritrade’s ‘The Watch List’ to discuss the market, what investors have learned from earnings season thus far and

Ron Saba weighs in on shifting focus from tech stocks to so-called value stocks in the Wall Street Journal. Read Article

The squeeze on homebuyers appears to be getting tighter by the month—which could spell trouble for multiple sectors of the economy in the future. Today,
Horizon’s Head of Portfolio Management, Zach Hill, CFA®, discussed his expectations for earnings estimates, the impacts of inflation, and his thoughts on specific sectors. Watch
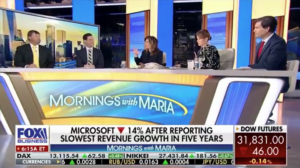
CIO Scott Ladner joined Maria Bartiromo on Fox Business to discuss the impact of inflation on earnings and his thoughts on the economy and a

Zach Hill, CFA® shares his expectations around negative demand, the next Fed meeting, and his thoughts on particular sectors. Watch the Video
Horizon Investments CIO Scott Ladner explains the lull in chip demand and why now is the time to invest in tech stocks on ‘The Claman

“It’s interest rates that are driving equity volatility, that is the way we have been looking at things all year, that is kind of the

We all know that last week’s inflation report showed headline inflation continues to surge, with the consumer price index (CPI) accelerating by 8.2% in September
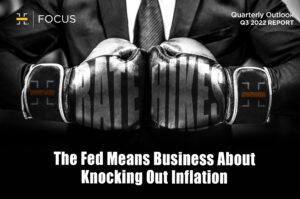
Central bankers have become laser-focused on crushing inflation. What could that mean for the economy and investors? Overview Investors found few places to hide from
Gain Strategies This year’s punishing price action across markets continued last quarter as global stocks (MSCI ACWI Index), and core bonds (Bloomberg U.S. Aggregate Index)

Head of Portfolio Management Zach Hill, CFA® joins Yahoo! Finance to weigh in on recent market volatility, bond yields, and why investing in equities may
CIO Scott Ladner joins BNN Bloomberg to discuss the BOE announcement, global growth, and sectors.

CIO Scott Ladner joins CNBC to discuss Treasuries, the Fed’s next moves, and the impact of inflation on the markets.

It’s a game of “catch me if you can” between investors and the Fed these days. For the most part, the Fed’s recent series of
CIO Scott Ladner argues housing leads the economy and will cause a market ‘softening’ as he joins Maria Bartiromo on Fox News Media
Tomorrow, the Federal Reserve Board is set to announce its latest decision regarding interest rates. Will it be yet another 75-basis point increase, as many

“The recent CPI report threw cold water on hopes that the Fed could ease up on policy tightening aimed at cooling inflation.” Zachary Hill, CFA.

All eyes were once again on interest rates last week, as the European Central Bank (ECB)—the eurozone’s equivalent of the Federal Reserve Board–raised interest rates
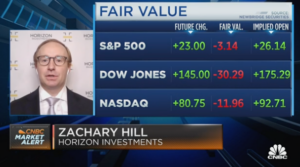
Head of Portfolio Management Zachary Hill, joined CNBC Worldwide Exchange to discuss the markets ahead of the August CPI print.

https://www.horizoninvestments.com/wp-content/uploads/2022/09/Fast-Take-With-Zach-Hill.mp4 Hear Horizon’s view of the markets as we head into the fall, along with our expectations around Fed policy, global economic conditions, and our

Chief Investment Officer Scott Ladner, joined Cheddar News’ Closing Bell to discuss U.S. stocks after investors returned to trading action following Labor Day weekend.
Chief Investment Officer Scott Ladner joined ‘Morning with Maria’ to weigh in on the August jobs reports and unemployment rate.
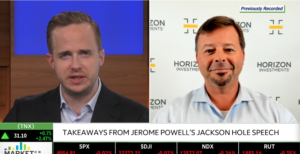
“Nominal GDP slowdown has been baked in the cake. The stock market today has started to move on from inflation to recession fears. Don’t fight

Demand for new homes is way down. What does that mean for investors? New home sales plunged in July, falling nearly 13% to a seasonally-adjusted

Historical Recessions Given the increase in signs of a cooling economy, this study aims to explain what typically happens before and during recessions, answering the

It’s a safe assumption that when Bob Dylan sang “the first one now will later be last,” he didn’t have financial markets in mind. And

What a difference a couple of months can make. Since hitting its low point (closing price) for the year on June 16, the S&P 500

Is More Volatility Coming Down the Pike? Investors looking for greater clarity about the road ahead for equities—and a break from market volatility—probably shouldn’t hold
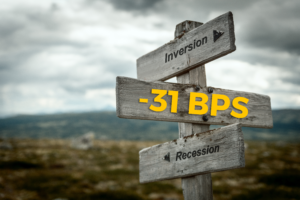
As investors digested both the Fed’s decision to raise interest rates by another 75 basis points and the news that U.S. economic growth declined in

The U.S dollar continues its steady march higher, up 14.7% during the past 12 months. That sharp rise, coupled with the euro’s ongoing slide, created

Scott Ladner, CIO of Horizon Investments, joins Worldwide Exchange to discuss his views on inflation and the Fed’s big decision this week.

Overview Investors faced a wall of worry during the second quarter that proved to be insurmountable for stocks, bonds and virtually every other asset
Gain Strategies The second quarter of 2022 was another difficult one for asset markets as investors continue to grapple with the outlook for inflation
Over the next few weeks, a steady stream of second-quarter earnings reports will reveal how companies have navigated historically high inflation, continued supply chain challenges,
The S&P 500 hasn’t seen two consecutive quarters of negative returns since the global financial crisis—until now, that is. The index’s -16.1% return during the

Economists surveyed by the Wall St. Journal now say there’s a 44% chance of a recession—up from just 18% in January. The newspaper noted that

Zach Hill, CFA and ERShares COO Eva Ados joined Yahoo Finance Live after the closing bell to examine the possibilities of a recession amid market

Red-hot inflation, and the Fed’s now-aggressive efforts to fight it, are pushing up mortgage rates at their fastest pace on record—and potentially putting the squeeze

Zach Hill, CFA®, head of portfolio management at Horizon Investments, says this bear market is likely to stick around a while. Photo Source: Traders work

CIO Scott Ladner joined Brigg MacAdam LTD founding partner Greg Swenson and Rosecliff Capital CEO Mike Murphy on ‘Word on Wall Street’ to unpack markets

American workers are reliving the past – and that’s a potentially big problem. The reason: Real wages adjusted for inflation have recently declined, in some

Equity markets sent investors smiling into the Memorial Day weekend, thanks to the biggest weekly gains for the S&P 500 (+6.6%) and the Dow Jones
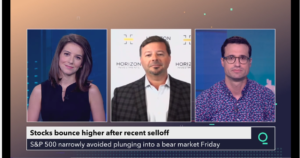
CIO Scott Ladner joined Bloomberg to share his expectations for the market and why boring investments may be prudent.
With the Nasdaq plummeting 27.2% and the S&P 500 Growth Index close behind at -26.2%, growth stock investors have taken it on the chin this

https://www.horizoninvestments.com/wp-content/uploads/2022/05/Horizon-Investmenst-Mid-Quarter-Update-Small.mp4

Last week ended with the S&P dipping briefly into bear market territory before closing higher on Friday. Inflationary pressures fueled by supply chain kinks and

CIO Scott Ladner joined Liz Claman to discuss this week’s market sell-off and share his thoughts on sectors, geopolitical risk, and the Fed.

Investors in balanced portfolios these days may feel like they’ve fallen off a tightrope. The classic portfolio of 60 percent equities and 40 percent fixed-income—the

Scott Ladner talks macroeconomics and a global view on markets with Ausbiz.

“…unless supply chains heal rapidly or workers flood back into the labor force, any equity rallies are likely on borrowed time as Fed messaging becomes
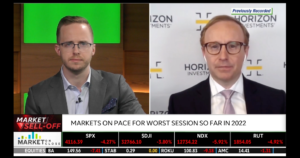
Stocks fell hard Thursday, May 5, 2022 following the FOMC meeting announcement in which the Federal Reserve raised rates by 50 basis points as the

Investors have been dumping high growth stocks for weeks, due to worries about inflation, rising interest rates and a potential economic slowdown. Horizon’s Zach Hill

Scott Ladner on air for Mornings with Maria Bartiromo. Scott sheds light on the micro vs macro market drivers. Tune in around the 2:20 marker.

Scott Ladner joins Kristina Hooper after the closing bell yesterday on Yahoo Finance to discuss economic uncertainties behind China’s supply chain and COVID lockdowns, outlook

There’s something strange happening with energy ETFs. Zachary Hill, CFA comments on the sector’s flagships ETFs
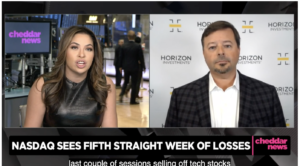
The broader tech sell-off comes after the Federal Reserve announced plans to hike interest rates in an attempt to cool inflation. Scott Ladner, CIO, Horizon

Investors liked what they heard from the Fed this week. The Federal Reserve Board raised the Federal Funds Rate by 50 basis points (0.50 percentage

Bonds are usually thought of as a safe haven for investors due to their lower risk/ lower return profile. For investors preparing for retirement, or those

No doubt about it: Fixed-income investors are spooked. Volatility in U.S. Treasuries has soared this year. As seen in the chart, the 10-day moving average

The truth is, individual investors today don’t care as much about exposures as they do outcomes. They’re asking how to build portfolios that will help

We know that in Preservation, clients either ask or at least ponder: What product gives me all the upside and no downside? Ah, the holy

Kahneman’s Behavioral Approach Noise: an unwanted variability in decision-making. Ask yourself, when am I at my best? Are you a morning person? Are you a

Investment professionals rarely agree on the risks and direction of markets, yet many would agree that planning for retirement is one of the most important

We see active financial advice as the new reality. Not robo. Not passive. But active! Today, we can see an emerging problem with the “do

U.S. companies start to report the effect of decades-high inflation on their profit margins.

“Volatility in the bond market is simply too high right now…” Zachary Hill, CFA is quoted on CNBC earlier today. As investors are keeping their

As Americans become more comfortable with Covid-19’s transition from pandemic to endemic, two of our key expectations for this year are that consumer spending will
Now that the Federal Reserve Board has started raising rates, the upcoming first quarter earnings season could arguably be one of the most interesting and
Zachary Hill, CFA‘s insights on the economic health from a consumer and corporate perspective.

Stocks fluctuate to end whirlwind week. But have we hit the bottom?


Watch this short video as Scott Ladner discusses the current market environment, the Fed, interest rates and more on TD Ameritrade Network.
Horizon Investments CIO, Scott Ladner was on Mornings with Maria Bartiromo on Fox Business Network to discusses the impact the Russian invasion of Ukraine has
Horizon Investments CIO, Scott Ladner joins Yahoo Finance Live to discuss the outlook for the stock market ahead of President Biden addressing geopolitical tensions between

Zachary Hill, CFA, Head of Portfolio Management at Horizon Investments, reviews market volatility with TD Ameritrade. Tune in to find out more.

With such a choppy week so far in the markets, we pose the question, ‘Will the Federal Reserve run to the rescue?’. Listen to Scott

In case you missed it, check out Horizon Investments’ CIO Scott Ladner discussing his market sector picks on ‘Mornings with Maria’ on Fox Business Channel.

Listen to what Scott Ladner, Horizon CIO, and Kevin O’Leary, O’Shares, say about hedging against rising inflation.

Tracking alternative investments to Treasurys Kevin O’Leary of O’Shares and Scott Ladner of Horizon Investments discuss their favorite alternatives to bonds in the hunt for

One sector’s secret weapon against rising inflation, according to ETF manager Alexi Panagiotakopoulos of Fundamental Income joins Kevin O’Leary of O’Shares and Scott Ladner of
Stocks closed the first trading week of 2022 in the red as investors digested a key report on the U.S. labor market recovery at the
Kevin O’Leary of O’Shares joins Scott Ladner of Horizon Investments to discuss how to invest in an inflationary environment.

Flush with new cash, Horizon Investments is even better positioned to provide first-rate advice to investors on the best ETFs and funds in the market.

Check out what Zachary Hill, CFA, Horizon Investments’ Head of Portfolio Management, had to say about defensive stocks and what we could see in this
Tech stocks spur Wall Street slide as investors continue to monitor inflation impact
The waiting game is almost over. Zachary Hill, CFA weighs in onthe Fed’s decision coming tomorrow.
Investors sure are a gloomy bunch these days. How downbeat are they? According to the AAII Investor Sentiment Survey1 (a weekly poll measuring individual investors’

As expected, the Federal Reserve Board on Wednesday raised the target range of the federal funds rate—a key short-term interest rate—by 25 basis points from


Inflation sticker shock is spreading; 55% of the items in the Consumer Price Index have an annual inflation rate of at least 5% in October.

Many investors and financial advisors are still in the dark on what ESG factor investing means and how quickly the data behind this style of

Inflation sticker shock is spreading; 55% of the items in the Consumer Price Index have an annual inflation rate of at least 5% in October.

Inflation sticker shock is spreading; 55% of the items in the Consumer Price Index have an annual inflation rate of at least 5% in October.
Inflation sticker shock is spreading; 55% of the items in the Consumer Price Index have an annual inflation rate of at least 5% in October.

Inflation sticker shock is spreading; 55% of the items in the Consumer Price Index have an annual inflation rate of at least 5% in October.

Inflation sticker shock is spreading; 55% of the items in the Consumer Price Index have an annual inflation rate of at least 5% in October.

Inflation sticker shock is spreading; 55% of the items in the Consumer Price Index have an annual inflation rate of at least 5% in October.
Inflation sticker shock is spreading; 55% of the items in the Consumer Price Index have an annual inflation rate of at least 5% in October.

Inflation sticker shock is spreading; 55% of the items in the Consumer Price Index have an annual inflation rate of at least 5% in October.

Inflation sticker shock is spreading; 55% of the items in the Consumer Price Index have an annual inflation rate of at least 5% in October.
Inflation sticker shock is spreading; 55% of the items in the Consumer Price Index have an annual inflation rate of at least 5% in October.
Inflation sticker shock is spreading; 55% of the items in the Consumer Price Index have an annual inflation rate of at least 5% in October.

Inflation sticker shock is spreading; 55% of the items in the Consumer Price Index have an annual inflation rate of at least 5% in October.
Inflation sticker shock is spreading; 55% of the items in the Consumer Price Index have an annual inflation rate of at least 5% in October.
Eye-popping jumps in energy prices worldwide has some people proclaiming we’re in a replay of the stagflation of the 1970s. That view ignores substantial

From the youngest to the oldest American workers – GenZ to Baby Boomers – their greatest fear about retirement is…

A large swath of the GenX population, many of whom are 20 years or less from the end of their working careers, say they don’t

The march higher in the cost of home health, assisted living or nursing home services continues. The blended cost of providing a year’s worth…

American workers just got another jolt of bad news about the financial health of Social Security. A recent report moved up the program’s insolvency date…
Federal Reserve Chairman Jay Powell repeated his view at last week’s Jackson Hole meeting that the jump in inflation would be “transitory” as supply…

There’s a record-breaking chasm opening up between American and Chinese stocks this year. The SPDR S&P 500 ETF (SPY) is outperforming…

The Baby Boomer retirement wave, egged on by Covid, rolls on. Another 248,000 Americans over the age of 65 left the labor force last month…
The Baby Boomer retirement wave, egged on by Covid, rolls on. Another 248,000 Americans over the age of 65 left the labor force last month…
You’ve likely heard that second quarter profits are surging, driven by easy year-over-year comparisons and the reopening of the economy…

Target date funds operate under the assumption that someone’s asset allocation should follow a glide path, automatically shifting a portfolio…
Yet another setback for retirees who view traditional fixed-income investments as a secure way to fund a long retirement…
The July 4th holiday’s fireworks extended into the work week on Wall Street. The 10-year Treasury note rallied further and faster than many…

The Federal Reserve’s meeting last week sparked a selloff in stocks and bonds as the central bank’s projections showed it may bump up interest rates..

Capturing the pandemic’s weird real-world effects is reflected in how high above trend retail sales are, at 12.9%, versus how far…
Bidding wars for homes has soured people on reaching for the American dream: for the first time in nearly 40 years, a majority of…
What was a rumbling of change in the last few years is now barreling into the mainstream with widespread name recognition of Bitcoin and…
What was a rumbling of change in the last few years is now barreling into the mainstream with widespread name recognition of Bitcoin and…
They’re very different Presidents, but what Joe Biden and Donald Trump have in common is their drive to make America’s economic growth rate…

They’re very different Presidents, but what Joe Biden and Donald Trump have in common is their drive to make America’s economic growth rate…
They’re very different Presidents, but what Joe Biden and Donald Trump have in common is their drive to make America’s economic growth rate…

Millions of workers are retiring early. But not necessarily because they want to. The pandemic is pushing them to bow out of a job, according
When financial markets went haywire in March 2020, people pursuing a traditional financial plan may have been tempted to do something…
Of all the financial challenges facing retirees, being a widow can be one of the most difficult to bear. As the U.S. comes to the

Nearly every day the financial news headlines trumpet the selloff in bonds and the rising yields that go along with it. Some market pundits…

A common investor assumption is that bonds tend to go up in value when the stock market is sliding. That’s been true during the bond

Like the famous Energizer Bunny, small-capitalization stocks keep on going versus their larger peers. Year to date, the S&P Small-Cap 600 Index is…

They’re very different Presidents, but what Joe Biden and Donald Trump have in common is their drive to make America’s economic growth rate…
On Wednesday, March 10, 2021, Scott Ladner, Horizon’s Chief Investment Officer, spoke with CNBC Pro’s Yun Li around the S&P 500’s record close as Biden

Does 2021 strike you as a replay of 1999? The investment theme now, as it was then, is to buy the companies on the leading

Many investors and financial advisors are still in the dark on what ESG factor investing means and how quickly the data behind this style of

A common investor assumption is that bonds tend to go up in value when the stock market is sliding. That’s been true during the bond

Federal Reserve chairman Jay Powell’s speaking engagement on March 4 is, in Horizon’s view, critical for the central bank’s messaging and…
Up, up and away for the price of a new single-family home, which reached a record high $408,800 to kick off 2021. Goals-based clients who

Investors who are globally diversified may be seeing that pay off at the start of 2021. Emerging market (EM) stocks are ripping, up 8.2% year

Inflation isn’t a problem now, but financial markets are saying it could be soon. Traders are pricing in the possibility that Consumer Price Inflation…
Here’s another knock against putting all of your retirement-income eggs in the bond market basket. This week is ushering in record low yields of…
A common investor assumption is that bonds tend to go up in value when the stock market is sliding. That’s been true during the bond
A common investor assumption is that bonds tend to go up in value when the stock market is sliding. That’s been true during the bond
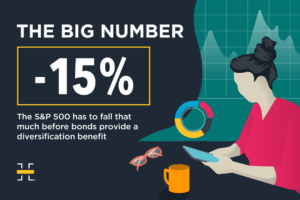
A common investor assumption is that bonds tend to go up in value when the stock market is sliding. That’s been true during the bond
A record high for stocks…again. Earnings get much of the credit for the latest move. More than half of the S&P 500’s companies have reported

When stocks fall, bonds rally. That’s standard market action today. And it makes bonds look like a reliable way to counteract the stock market’s inevitable…
