

Gain Stage Portfolios
Clients in the Gain stage are generally younger or have a longer time horizon before they need to fund a goal. The main objective in this stage is long-term growth, and the main risk is volatility. Meeting clients’ goals typically involves:
- Selecting the most suitable portfolio focusing on equities for long-term growth.
- Continually contributing to the portfolio to maximize wealth potential.
Given the main objective of this stage is growth while mitigating volatility, prioritizing total return and risk-adjusted return measures may make sense. We believe the approach of traditional investment management that seeks to maximize return per unit of risk applies most appropriately to investment selection in this stage since time isn’t a constraint like it is for pre-retirees.
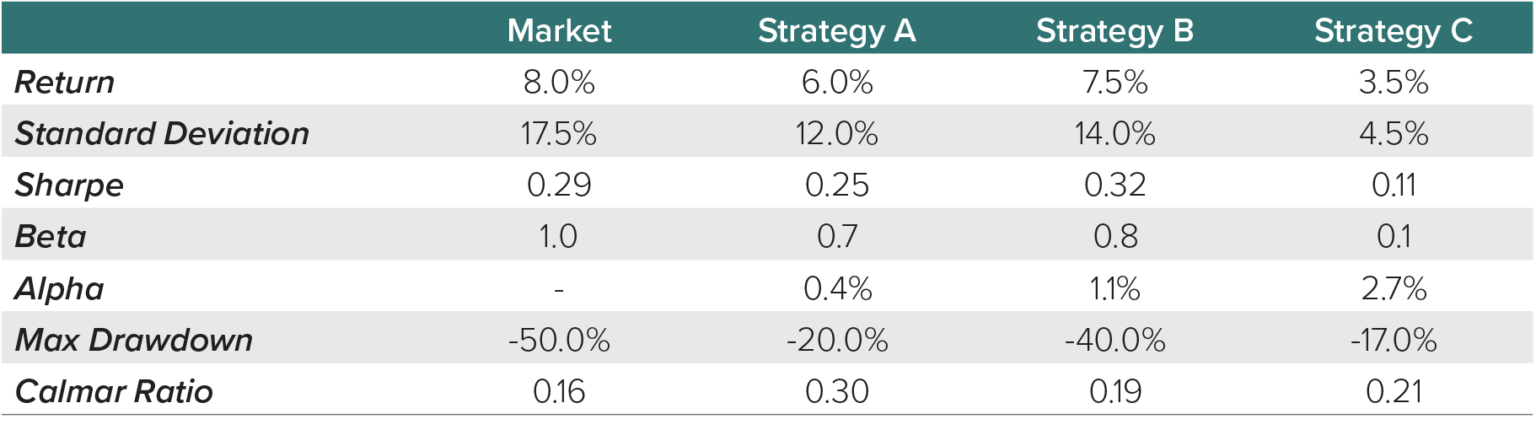
The following table compares strategies relative to equity market performance over a full market cycle. We will use the metrics to determine a recommendation for an accumulation investor based off the goal and risk identified for this stage.

Based on the information provided in the table, we believe the best fit for an accumulation mandate in the Gain stage is Strategy B. Here’s why:
- Given the objective for these portfolios is long-term growth, Beta relative to the stock market is a relevant consideration. Strategy A and B have similar Betas to the Market. Strategy C has a low Beta relative to the market, which may present challenges for achieving long-term growth.
- Since traditional investment management aims to maximize return for expected risk, prioritizing higher risk-adjusted metrics may make sense in the Gain Stage. Strategy B leads Strategy A in Sharpe Ratio and Alpha. While Strategy C leads both A and B in Alpha, its long-term return expectations may not be high enough for clients in this stage.
- Even though Strategy B may suffer a sharper maximum drawdown than Strategy A and C, Gain stage clients generally have long time horizons to allow for recoveries.
Protect Stage Portfolios
Clients in the Protect, or preservation, stage are generally pre-retirees or within 5-7 years of funding a goal. This stage’s main objective is preserving wealth; the main risk is absolute drawdown or loss. Achieving success for clients in this stage is about smoothly transitioning them from the accumulation stage to the distribution stage by focusing on two main principles:
- Maintaining a portfolio tilted toward equities for some growth potential.
- Having a process for mitigating catastrophic loss.
Given the main objective of this stage is risk mitigation, we think it makes sense to prioritize downside-related metrics like Max Drawdown and Calmar ratio. The traditional investment management framework that has historically been relied upon becomes less helpful in this stage as clients tend to be more focused on protecting against catastrophic loss rather than risk-adjusted statistics. Clients are typically seeking risk mitigation when they move to cash during periods of market stress. They’re more focused on limiting losses than optimizing risk-adjusted returns.
The following table compares strategies relative to equity market performance over a full market cycle. We will use the metrics to determine a recommendation for a preservation investor.
Based on the information provided in the table, we believe the best fit for a preservation mandate in the Protect stage is Strategy A. Here’s why:
- Given that clients in this stage still may need moderate exposure to stocks for growth potential, total return and Beta relative to equity markets are both relevant considerations.
- Given the objective of this stage is preserving wealth while mitigating against absolute drawdown, prioritizing downside-related metrics may make sense. While Strategy C has the lowest Max Drawdown, Strategy A has the highest Calmar Ratio, which suggests that Strategy A’s return per unit of max drawdown is the highest.
- Even though Strategy A has lower risk-adjusted returns, as measured by Sharpe and Alpha, than Strategy B, the maximum drawdown experienced by Strategy B may be significant enough to threaten the objective of wealth preservation. Further, a 40% drawdown experienced by a client in the Preservation stage may result in them abandoning their financial plan.
Spend Stage Portfolios
Clients in the Spend, or distribution, stage are often retired or at a point where they are using their investment portfolio to fund their goals. The main objective in this stage is maximizing longevity, and the main risk is running out of money. Achieving success for clients in this stage incorporates the following:
- Understanding the client’s current withdrawal need and selecting the portfolio with the appropriate allocation to provide sustainable growth for future withdrawals.
- Having a process for mitigating catastrophic loss.
Given the objectives and risks of this stage, reviewing risk-adjusted returns and drawdowns are considerations, but may be a lower priority. As such, traditional risk tolerance typically becomes less meaningful in this stage, as the goal is to provide sustainable withdrawals, regardless of their traditional appetite for risk.
The following table compares strategies associated with equity market performance over a full market cycle. We will use the metrics to determine a recommendation for a distribution investor.
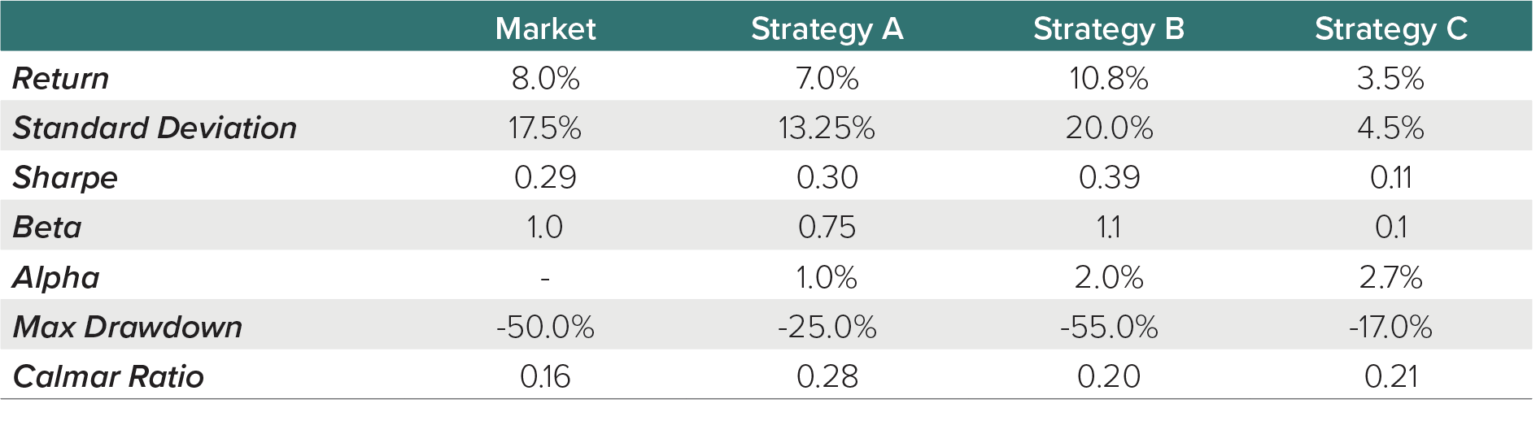
Based on the information provided in the table, we believe the best fit for a distribution mandate in the Spend stage is Strategy A. Here’s why:
- Given that clients in this stage need stock exposure for growth potential to support future withdrawals, total return and Beta relative to equity markets are relevant considerations. Strategy C’s total return of 3.5% per year is likely not an appropriate solution for clients who need to withdraw 4% or more per year over an extended period.
- Given the need for downside protection during this stage, reviewing downside metrics is appropriate. Strategy A has the highest Calmar Ratio, which suggests that the return per unit of max drawdown is the highest.
- While Clients invested in Strategy B may have the highest return over long time horizons, a sharp maximum drawdown experienced in this stage can significantly impact how long retirement savings may last.
Conclusion
Successful investing for clients is often more complex than building a portfolio with the highest historical risk-adjusted return. The job of a prudent goals-based financial advisor entails knowing what stage of the investment journey their client is in, which portfolios may be appropriate for each stage, and their client’s risk tolerance, and then selecting suitable investments for the portfolio. We believe comprehensive investment selection and monitoring entails reviewing all relevant metrics and recognizing that some may be more important than others depending on the client’s stage of the investment journey. Employing a goals-based approach to investment selection may help identify the most appropriate strategies to meet your client’s goals while potentially mitigating their risks.