

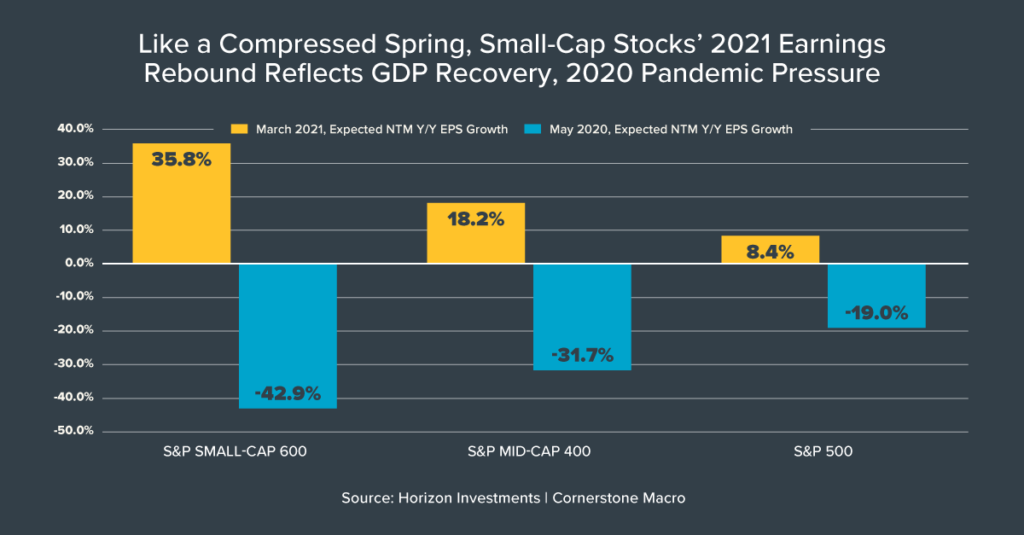
The expected year-on-year earnings per share growth for the S&P 600 Small-Cap Index
Like the famous Energizer Bunny, small-capitalization stocks keep on going versus their larger peers. Year to date, the S&P Small-Cap 600 Index is up 24.9% versus 14.7% and 5% for the S&P Mid-Cap 400 and S&P 500 indexes. Credit for that goes to stimulus spending and an earnings recovery.
The U.S. economy is now expected to grow 6.5% this year after passage of the $1.9 trillion stimulus package, according to the Organization for Economic Cooperation and Development1. That’s double the group’s 3.2% projection in December when the bill’s price tag was far from clear1. Faster growth is good news for small-caps which have more domestic exposure than other parts of the stock market. In addition, the rebound in manufacturing activity and the surge in commodities makes a big contribution to Small-Cap 600 performance given its larger sector weightings in those areas compared to the other indexes.
Where those trends come together is in earnings forecasts. Analysts now see small-cap profits growing by 35.8% year-on-year over the next 12 months, according to Cornerstone Macro2. That’s four-times faster than the expected growth in earnings for S&P 500. The small-cap earnings gusher not only reflects GDP, manufacturing and commodities, but also just how bad it was last year as the pandemic shut down the economy. At the nadir in May, analysts were forecasting profits to plunge 42.9% – a far more dire outlook than what was predicted for mid- and large-cap stocks2.
Horizon Investments continues to prefer smaller companies over larger ones (a topic we wrote about in December comparing Apple to the Russell 2000, and in January as small-caps blasted off relative to large-caps). In our view, smaller firms can still benefit from the brightening view of American economic growth, potential supply/demand imbalances for commodities and the back-up in bond yields which is corrosive to highly-valued, innovative companies.
After years of investors focusing their investments on a concentrated group of large companies, times may be changing. Capitalizing on that shift could present an opportunity for active managers versus a passive approach that may be tied to capitalization-weighted indexes. Should just a small fraction of money shift from mega-caps to small-caps it could have a meaningful impact. The Nasdaq 100’s market capitalization is $14.8 trillion versus $1.2 trillion for the S&P Small-Cap 600.
1 OECD Economic Outlook, Interim Report March 2021, March 9, 2021, https://www.oecd-ilibrary.org
2 Cornerstone Macro earnings estimates dashboard as of March 16, 2021
Further reading:
Soaring Innovation Companies Go Cold as Interest Rates Rise: Big Number
You May Need a Bigger Down Payment for a New Home: Big Number
Emerging Markets Are Surging – And Evolving: Market Notes
Inflation Could Be Coming, Are You Ready?
Disappearing Junk Bond Yields
Do Bonds Really Offset Stock Market Declines?
If Inflation Returns, Bond’s Diversification Power May Disappear
Essentially Nothing. That’s How Much Bonds May Return Over Next Five Years
High & Mighty Stocks; Feeling Inflationary?; Game Stopped: Market Notes
Bond Market Bears Growling as 10-Yr Yield Tops 1%
It’s Getting Harder to Fund Retirement Using Bonds
7.9 Trillion Reasons Not to Fight the Fed, ECB, BOJ or BOE
The Stock Market Is Strange, But Not Broken by GameStop: Market Notes
In Current Markets, Only Two Words Matter: Stimulus Spending
This commentary is written by Horizon Investments’ asset management team. For additional commentary and media interviews, please reach out to Chief Investment Officer Scott Ladner at 704-919-3602 or sladner@horizoninvestments.com.
To download a copy of this commentary, click the button below.

To discuss how we can empower you please contact us at 866.371.2399 ext. 202 or info@horizoninvestments.com.
Nothing contained herein should be construed as an offer to sell or the solicitation of an offer to buy any security. This report does not attempt to examine all the facts and circumstances that may be relevant to any company, industry or security mentioned herein. We are not soliciting any action based on this document. It is for the general information of clients of Horizon Investments, LLC (“Horizon”). This document does not constitute a personal recommendation or take into account the particular investment objectives, financial situations, or needs of individual clients. Before acting on any analysis, advice or recommendation in this document, clients should consider whether the security in question is suitable for their particular circumstances and, if necessary, seek professional advice. Investors may realize losses on any investments. Index information is intended to be indicative of broad market conditions. The performance of an unmanaged index is not indicative of the performance of any particular investment. It is not possible to invest directly in an index.
Past performance is not a guide to future performance. Future returns are not guaranteed, and a loss of original capital may occur. This commentary is based on public information that we consider reliable, but we do not represent that it is accurate or complete, and it should not be relied on as such. Opinions expressed herein are our opinions as of the date of this document. These opinions may not be reflected in all of our strategies. We do not intend to and will not endeavor to update the information discussed in this document. No part of this document may be (i) copied, photocopied, or duplicated in any form by any means or (ii) redistributed without Horizon’s prior written consent.
Other disclosure information is available at hinubrand.wpengine.com.
Horizon Investments and the Horizon H are registered trademarks of Horizon Investments, LLC
©2021 Horizon Investments LLC
