Search
Close this search box.

Turbulence Ahead?

Stock investors may want to brace for some bumps in the road.

After months of gains and low volatility from stocks, emerging signs show that supportive equity
trends are taking a pause, and the market could experience some chop in the coming weeks.

This week, for example, the S&P 500 closed at its lowest level since July 11 and dipped below its
50-day moving average1 (a gauge of market momentum) for the first time since late March, as shown in the chart below.

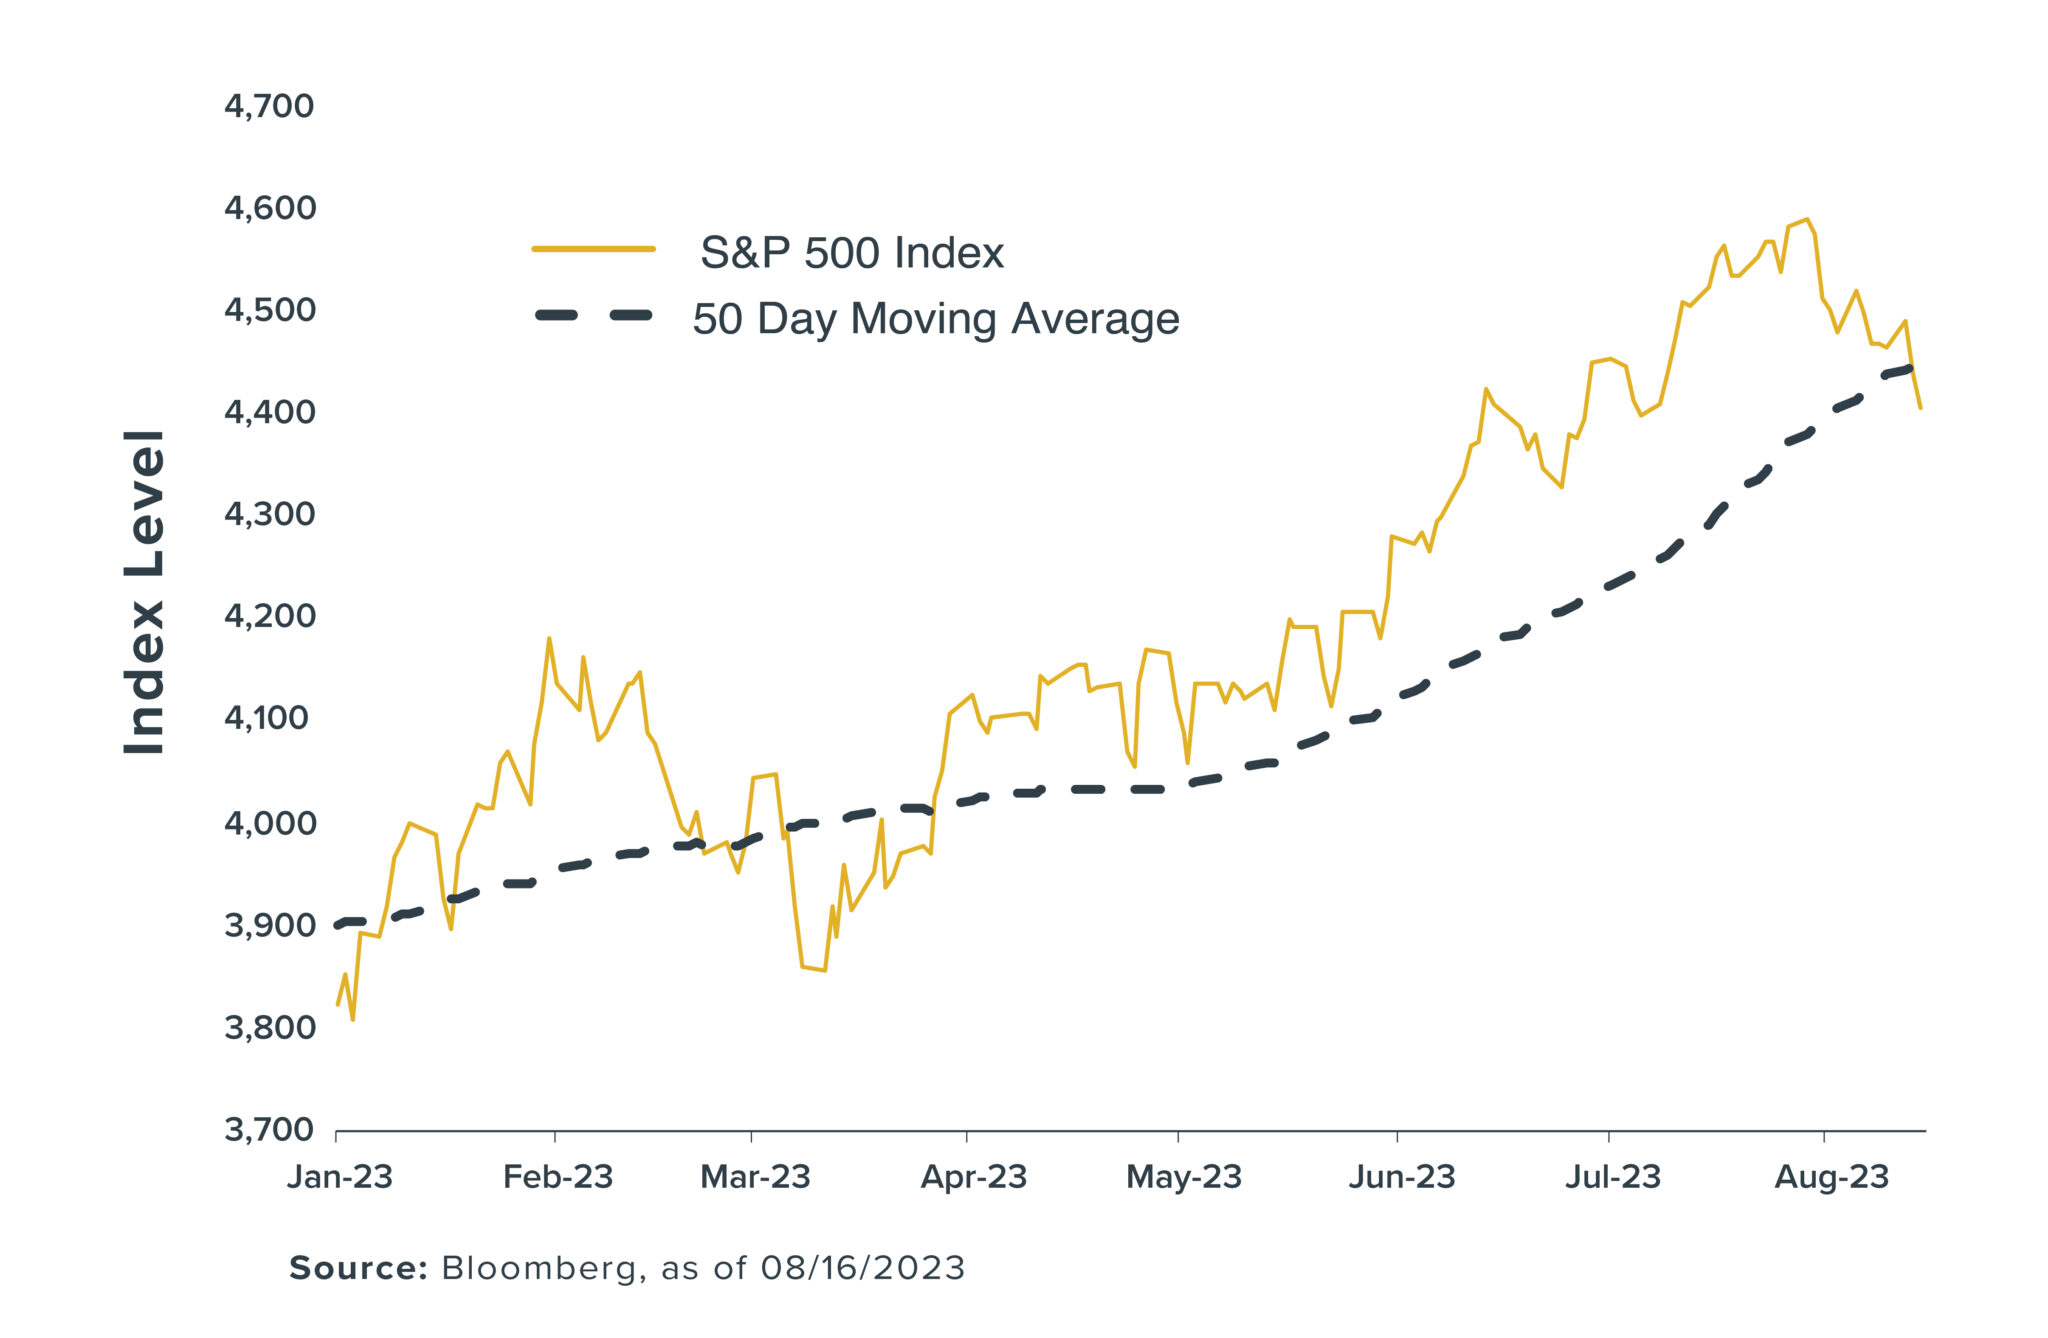
Until this week, the S&P 500 had closed above its 50-day moving average for 95 consecutive sessions—the index’s longest run since a 102-session streak ended in September 2020.

The recent downward pressure on stocks could intensify in the coming weeks, particularly if further weakness prompts large systematic investors—who use moving averages and other quantitative data to adjust their portfolios—to head for the exits. More negative economic news from China or unwelcome comments from central bankers at next week’s Jackson Hole Economic Symposium could be catalysts to push stock prices lower.

Compounding that potential risk: Many of these systematic investors have steadily increased their stock exposure over the past year. For example, one systematic index’s2 equity allocation is the highest since December 2021. At its current level, $1 of exposure to this index has more than $1 of exposure to equities.

It’s not uncommon for stocks to suffer a late-summer slump. According to Dow Jones data, September has historically been the worst month for S&P 500 performance. Although numerous other factors remain supportive of stocks,  don’t be surprised if there are further pullbacks before the market regains its upward momentum.

1 The S&P 500® 50-day moving average is the average price over the past ten trading weeks. 

2 The S&P 500® Low Volatility Daily Risk Control 10% Index represents a portfolio of the S&P 500 Low Volatility Index plus an interest accruing cash component. The index is dynamically rebalanced to target a 10% level of volatility. Volatility is calculated as a function of historical returns.

Disclosures

This commentary is written by Horizon Investments’ asset management team. 

Past performance is not indicative of future results.

Nothing contained herein should be construed as an offer to sell or the solicitation of an offer to buy any security. This report does not attempt to examine all the facts and circumstances that may be relevant to any company, industry, or security mentioned herein. We are not soliciting any action based on this document. It is for the general information of clients of Horizon Investments, LLC (“Horizon”). This document does not constitute a personal recommendation or take into account the particular investment objectives, financial situations, or needs of individual clients. Before acting on any analysis, advice, or recommendation in this document, clients should consider whether the security in question is suitable for their particular circumstances and, if necessary, seek professional advice. Investors may realize losses on any investments. The S&P 500 or Standard & Poor’s 500 Index is a market-capitalization-weighted index of the 500 largest U.S. publicly traded companies. Reference to an index does not imply that any account will achieve returns, volatility, or other results similar to that index. An index’s composition may not reflect how a portfolio is constructed in relation to expected or achieved returns, portfolio guidelines, restrictions, sectors, correlations, concentrations, volatility or tracking error targets, all of which are subject to change. Individuals cannot invest directly in any index. Indices are unmanaged and do not have fees or expense charges, which would lower returns. The investments recommended by Horizon Investments are not guaranteed. There can be economic times when all investments are unfavorable and depreciate in value. Clients may lose money. 

Asset allocation cannot eliminate the risk of fluctuating prices and uncertain returns. All investing involves risk of loss, and in periods of market growth, risk mitigation strategies can be expected to lag in performance behind equity strategies that do not focus on risk mitigation. 

This commentary is based on public information that we consider reliable, but we do not represent that it is accurate or complete, and it should not be relied on as such. Opinions expressed herein are our opinions as of the date of this document. These opinions may not be reflected in all of our strategies. We do not intend to and will not endeavor to update the information discussed in this document. No part of this document may be (i) copied, photocopied, or duplicated in any form by any means or (ii) redistributed without Horizon’s prior written consent. Forward-looking statements cannot be guaranteed.

Other disclosure information is available at www.horizoninvestments.com.

Horizon Investments and the Horizon H are registered trademarks of Horizon Investments, LLC

©2023 Horizon Investments LLC

You are now leaving this website to go to HorizonMutualFunds.com