

The losers of the past are riding high—while yesterday’s winners appear to be out of gas.
To sail to your destination, you need to put your boat in the water. If you can find the right current and wind angle, however, you might be able to get there much faster.
Likewise, broad exposure to financial markets is an important component of an investment strategy. But to find a more efficient path toward your goals, it may be helpful to consider sectors that are performing well in the current environment.
The challenge, of course, is that market leadership is dynamic—not static. Consider the chart, which shows how that leadership has flipped in recent years:
● Energy stocks lagged the S&P 500 Index by a whopping 22.8 percentage points over the one-year period through November 4th, 2019.
● Today, however, energy stocks have trounced the index by 80.5 percentage points over the past 12 months.
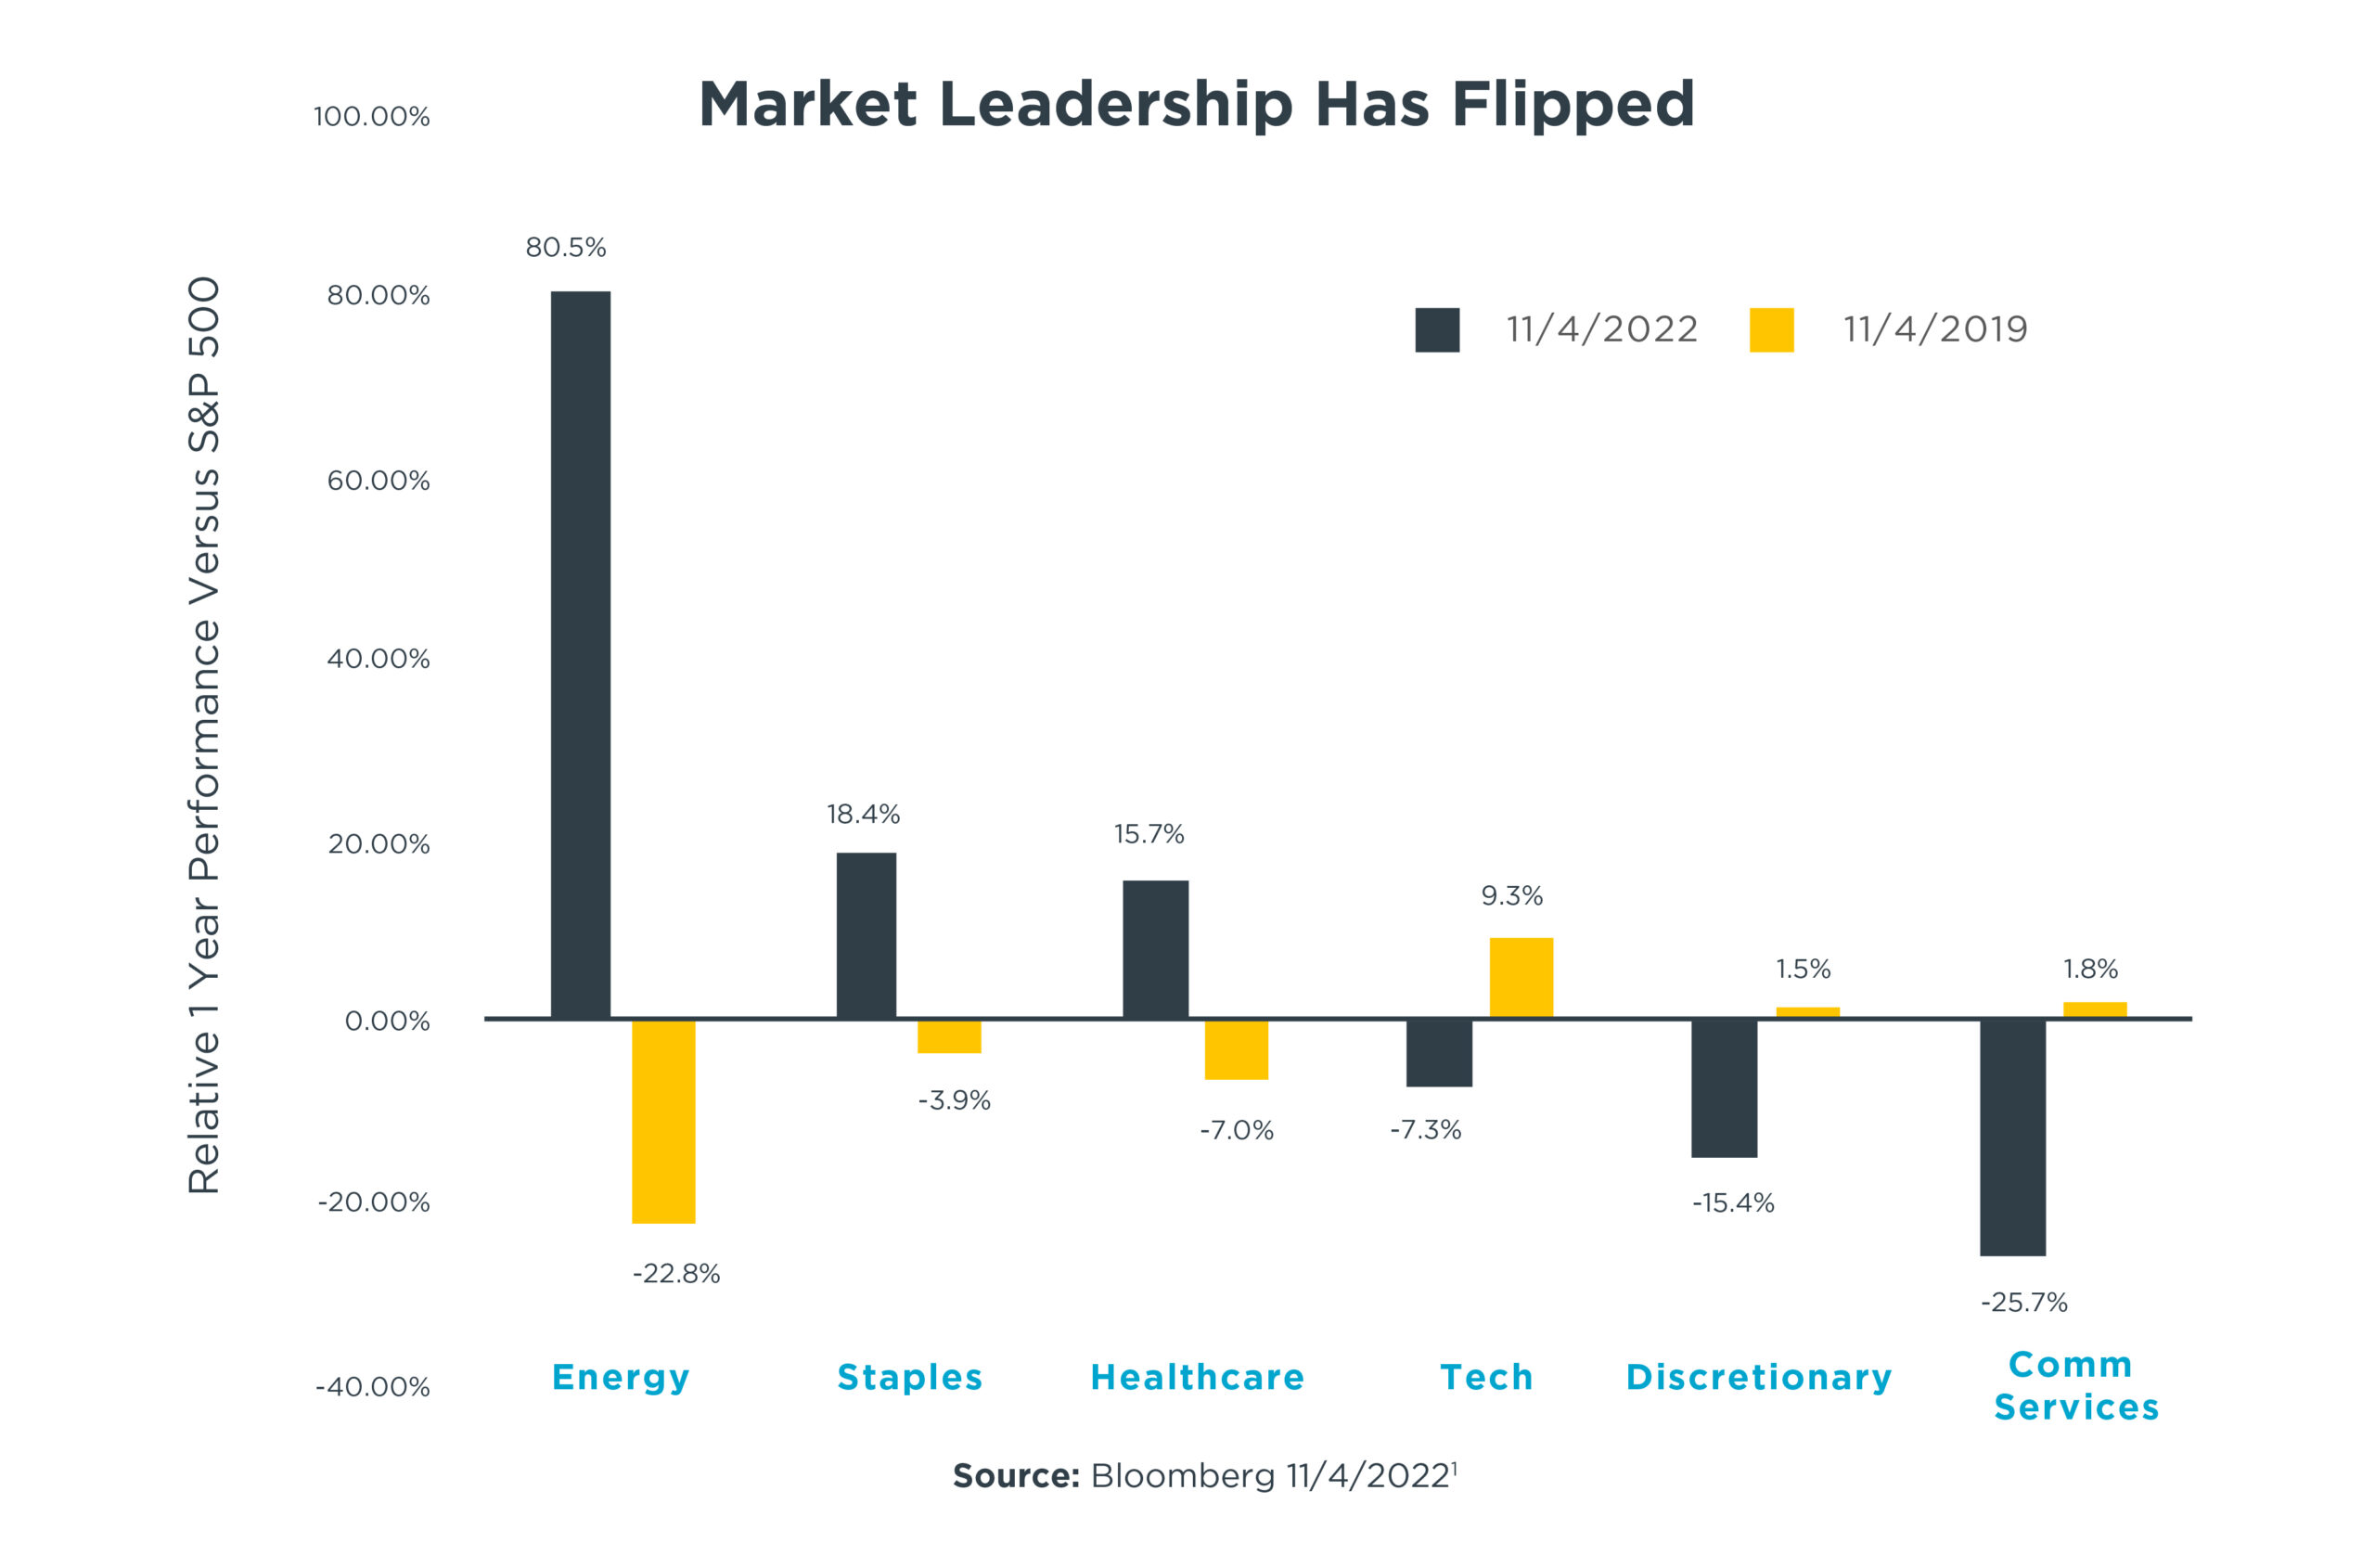
This leadership flip can be seen in other key market sectors as well1. Consumer staples stocks—which trailed the S&P 500 Index by nearly four percentage points back in 20192—have outrun the index by more than 18 percentage points during the past year.
Meanwhile, favored sectors from a few years ago are now struggling to keep pace. While tech stocks beat the S&P 500 by 9.3% then, they’re 7.3 percentage points behind the broad market during the past 12 months. Likewise, once-strong sectors like consumer discretionary and communication services have been lagging.
At Horizon, we’ve overweighted energy, consumer staples, and health care in our GAIN portfolios—and underweighted tech, consumer discretionary, and communication services. Three years ago, however, our portfolios were weighted differently.
The message: The significant transitions in market leadership we’ve seen—as well as the changes in factors such as Fed monetary policy and interest rates—highlight the potential benefits of active portfolio management, especially when conditions change. A flexible and opportunistic approach to the investment process may help navigate market environments as they evolve and potentially keep clients’ goals-based plans on course.
![]()
1 S&P 500 GICS Level 1 Sectors
2 Sector return versus S&P 500 return, 12 months through 11/4/19
Disclosure:
This commentary is written by Horizon Investments’ asset management team.
Past performance is not indicative of future results.
Nothing contained herein should be construed as an offer to sell or the solicitation of an offer to buy any security. This report does not attempt to examine all the facts and circumstances that may be relevant to any company, industry, or security mentioned herein. We are not soliciting any action based on this document. It is for the general information of clients of Horizon Investments, LLC (“Horizon”). This document does not constitute a personal recommendation or take into account the particular investment objectives, financial situations, or needs of individual clients. Before acting on any analysis, advice, or recommendation in this document, clients should consider whether the security in question is suitable for their particular circumstances and, if necessary, seek professional advice. Investors may realize losses on any investments.
This commentary is based on public information that we consider reliable, but we do not represent that it is accurate or complete, and it should not be relied on as such. Opinions expressed herein are our opinions as of the date of this document. These opinions may not be reflected in all of our strategies. We do not intend to and will not endeavor to update the information discussed in this document. No part of this document may be (i) copied, photocopied, or duplicated in any form by any means or (ii) redistributed without Horizon’s prior written consent. Forward-looking statements cannot be guaranteed.
The S&P 500 or Standard & Poor’s 500 Index is a market-capitalization-weighted index of the 500 largest U.S. publicly traded companies. References to indices or other measures of relative market performance over a specified period of time are provided for informational purposes only. Reference to an index does not imply that any account will achieve returns, volatility, or other results similar to that index. The composition of an index may not reflect the manner in which a portfolio is constructed in relation to expected or achieved returns, portfolio guidelines, restrictions, sectors, correlations, concentrations, volatility, or tracking error targets, all of which are subject to change. Individuals cannot invest directly in any index.
Other disclosure information is available at hinubrand.wpengine.com.
Horizon Investments and the Horizon H are registered trademarks of Horizon Investments, LLC
©2022 Horizon Investments LLC
