OVERVIEW
Stocks during the first quarter of 2024 extended the rally that began late last year, with major market indices frequently hitting new highs during the three months.
- The S&P 500 index of large-company stocks notched 22nd all-time highs during the quarter, gaining 10.6%—the index’s best first-quarter return since 2019—and ending the quarter at a record high.
- The Dow Jones Industrial Average also closed out the quarter at a record high, up 6.1%—its best first-quarter performance since 2021.
- The Nasdaq 100 returned 8.7% during the quarter.
- All three indices have seen five consecutive months of positive returns through March.
As we noted in our previous quarterly report, new market highs don’t necessarily signal that the market has peaked and is due for a fall. Instead, they have historically helped spur further advances—a dynamic in effect during the past three months.
Exhibit 1: Major Stock Market Indices Returns (Q1 2024)
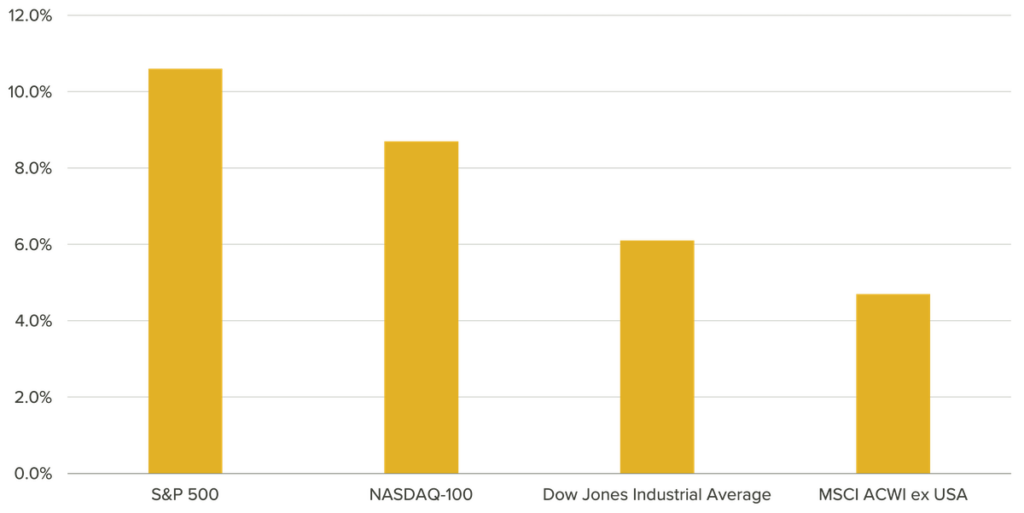
Source: Bloomberg, as of 03/31/2024
Past performance is not indicative of future results. Indices are unmanaged and do not have fees or expense charges, both of which would lower returns. It is not possible to invest directly in an index.
First-quarter gains in the U.S. stock market were primarily driven by continued strong economic conditions helping keep the labor market robust. For example, March marked the 26th straight month that the unemployment rate has been below 4%—the longest consecutive stretch since the 1960s. That has given consumers (who account for about 70% of economic activity) the financial resources and the confidence to spend, boosting corporate revenues and profits. Shares of companies benefiting from the artificial intelligence (AI) tech trend posted particularly strong gains.
International equities also generated positive returns, driven by signs of slowing inflation and enthusiasm about the strong U.S. economy and its potentially positive impact on global markets. The MSCI ACWI ex- U.S. index of developed and emerging international markets returned 4.70% during the first quarter. One particularly bright spot among international markets was Japan, where the Nikkei index soared 20%—its best quarter since 2009. Japan benefited from corporate reforms and the Bank of Japan’s decision to end its negative interest rate monetary policy by raising short-term rates for the first time in nearly 20 years.
The fixed-income markets saw modest losses during the quarter, with the Bloomberg U.S. Aggregate Bond Index returning -0.8%. The yield on the 10-year Treasury note rose from 3.88% to 4.20%—pushing bond prices lower—as continued economic strength and signs of somewhat higher-than-expected inflation signaled to investors that the Federal Reserve Board would likely delay its expected interest rate cuts later into 2024. However, remember that the 10-year Treasury yield fell significantly during the final three months of 2023 (see Exhibit 2). Despite its recent increase, that yield remains well below where it stood last October.
Exhibit 2: Yield on the 10-Year Treasury (Q4 2023 – Q1 2024)
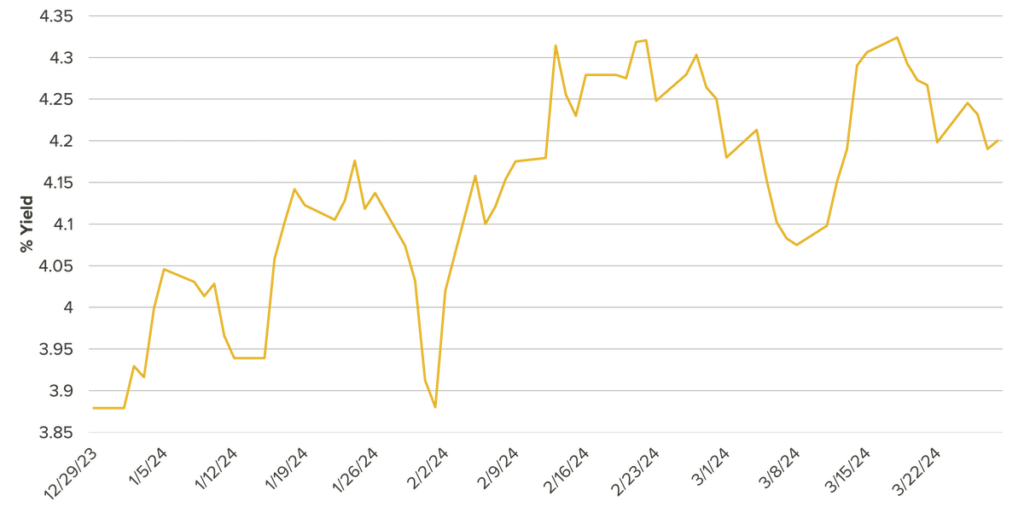
Source: Bloomberg, as of 3/28/2024
A MID-’90s REDUX
Much has been made in recent years of U.S. economic and financial conditions resembling those of the tumultuous late 1970s when inflation was rampant, the Fed aggressively raised interest rates to bring down prices, and the economy was in turmoil.
More recently, however, conditions have reminded many investors of a profoundly different era: the mid- 1990s, which marked the beginning of a booming period of robust economic growth, modest inflation, and a surging bull market in stocks.
So, is it time to pack away the satin shirts and disco balls? Should investors instead dust off their Beanie Babies and dance the Macarena?
Certainly, we see several key ways in which 2024 echoes the world of 30 years ago when Bill Clinton was President and American households and businesses were trying to wrap their heads around a new technology called the World Wide Web. For example:
- Rapid advances in technology. Companies like Microsoft, Netscape, and Cisco captured investors’ attention in the mid-‘90s as the Internet and computer networking evolved rapidly. Businesses increasingly incorporated those technologies into their operations, boosting worker productivity in ways that spurred additional growth and profits while lowering costs. Today, of course, artificial intelligence is all the rage among investors. While that technology is still very new, it shares a similar potential to be used by a wide range of businesses to materially enhance productivity, create sustainable competitive advantages, and drive growth.
- More historically normal interest rates. From 1994 into early 1995, the Federal Reserve Board hiked short-term interest rates quickly (from 3% to more than 6%). The Fed then proceeded to keep rates mostly stable—in a range between 5% and 6%—for the next several years. Despite those relatively high interest rates, economic and productivity growth were strong, inflation remained under control and unemployment fell. Likewise, the Fed is in a holding pattern today (see Exhibit 3) after rapidly raising interest rates from historically very low levels. Meanwhile, inflation is moderating, economic growth is robust, and unemployment remains low. Even if the Fed cuts rates later this year, as expected, rates will most likely remain higher than they were for much of the past 15 to 20 years.
Exhibit 3: Interest Rates, Then and Now
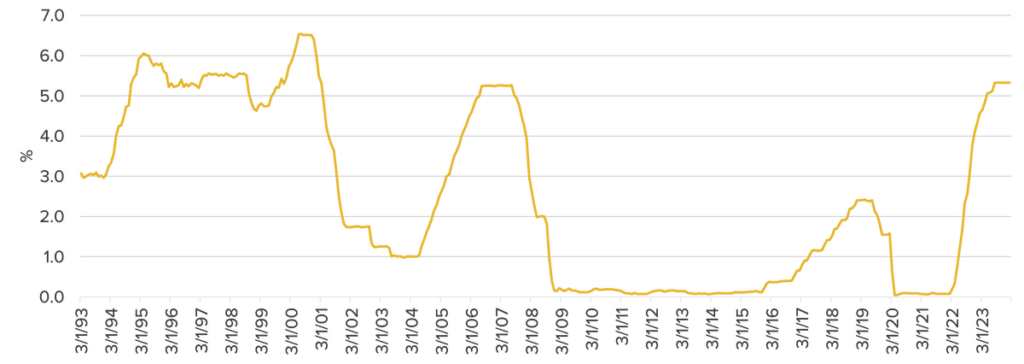
Source: Bloomberg, as of 2/29/2024
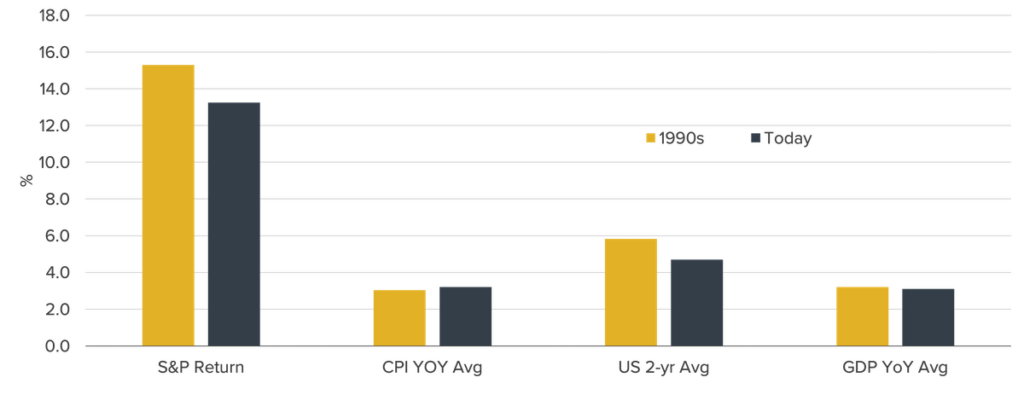
- Strong growth, moderate inflation, robust stock market. Exhibit 4 highlights how much these two time periods echo each other in important ways. Note the parallels between GDP growth and inflation (CPI). Meanwhile, the average yield on short-term bonds (2-year Treasury) is lower today than in the 1990s—and the S&P 500’s average return thus far in the 2020s is approaching the index’s average over the ‘90s. Taken together, it indicates that today’s economy can likely remain healthy despite higher interest rates than we’ve seen in many years.
Exhibit 4: Key Economic Metrics, 1990s vs Today Source: Bloomberg, calculations by Horizon Investments, as of 12/31/2023
Past performance is not indicative of future results. Indices are unmanaged and do not have fees or expense charges, both of which would lower returns. It is not possible to invest directly in an index. Market concentration. In both eras, equity market performance was concentrated among a relatively small number of stocks—namely, the hottest tech stocks of the time. While today’s top-heavy market environment demands that we watch for signs of a bubble, heavy concentration isn’t automatically a sign of concern—as evidenced by the S&P 500’s 28.5% annualized return from 1995 through 1999.
That said, today’s environment is hardly a perfect replay of the mid-1990s. Consider these distinct and important differences between then and now—some positive, some negative—that investors may want to consider going forward:
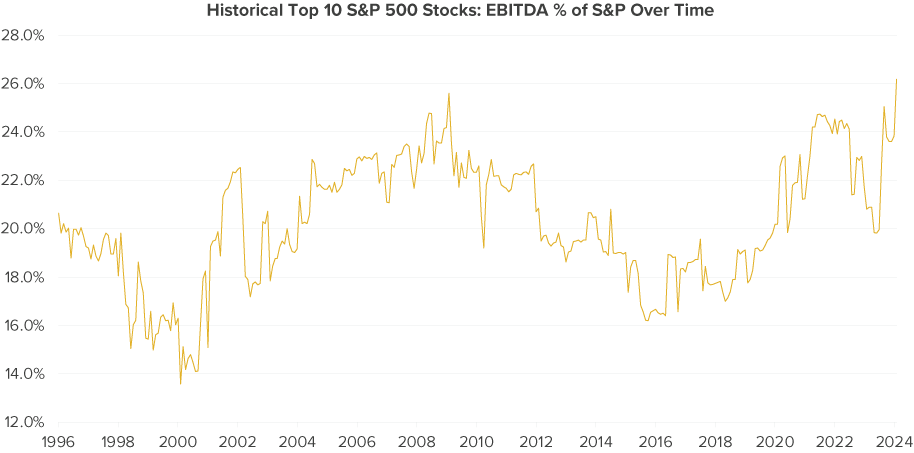
Today’s stock market leaders are financially strong. Although market concentration today is high by historical standards, the recent market leaders are financially healthy—certainly much more so than the early Internet companies whose stocks dominated the market during the late 1990s. Note the sizable gap in earnings between the top 10 stocks then and now, as shown in Exhibit 5. From this perspective, today’s market seems far less likely to be heading toward a bubble than it did three decades ago when investors didn’t seem to care whether a company made money.
Exhibit 5: Historical Top 10 S&P 500 Stocks: EBITDA % of S&P 500 Over Time
Source: S&P Global ClariFi®, calculations by Horizon Investments, as of 3/28/2024
EBITDA= Earnings before interest, taxes, depreciation, and amortization
Past performance is not indicative of future results. It is not possible to invest directly in an index.Large companies are less interest-rate sensitive today. In the mid-90s, the companies in the S&P 500 carried significantly greater levels of short-term debt that needed to be refinanced frequently. For example:
- S&P 500 companies’ short-term debt as a percentage of total debt has fallen to just 11.5% today.
- These companies’ interest payments as a percentage of their sales are just 1.6% today, down from closer to 3% in the mid-90s.
Ultimately, we believe that today’s large-cap companies are better positioned to weather a “higher for longer” interest rate environment, should that occur.
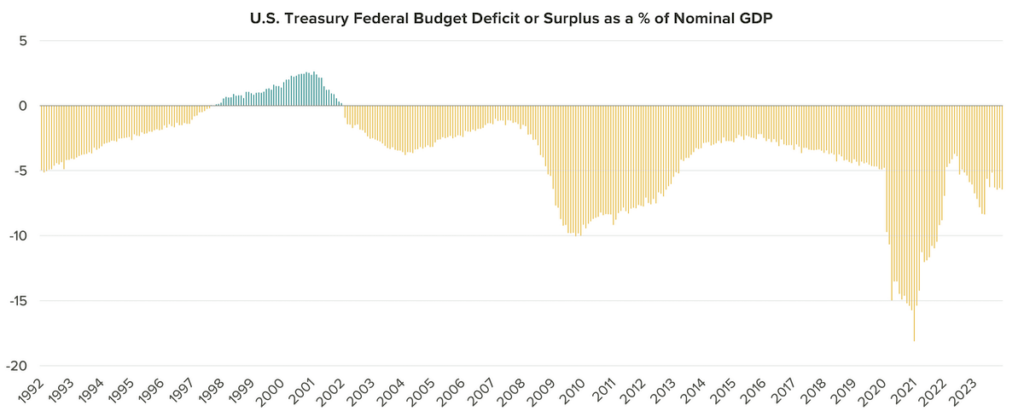
- Today’s budget deficit is far worse. The U.S. budget deficit in the mid-1990s was falling and heading toward a surplus, which occurred in the late 1990s and continued into the next century (see the green lines in Exhibit 6). Since then, budget deficits have become the norm again, and the government has been nowhere near running a surplus. Higher government spending boosts economic growth, at least in the short term, and could enable the economy to do well despite higher interest rates.
Exhibit 6: U.S. Treasury Federal Budget Deficit or Surplus Since 1993
Source: Bloomberg, calculations by Horizon Investments 02/29/2024 The rise of China as a global competitor. When its GDP was around $800 billion in the mid-‘90s, China was seen as a market for growth and U.S. expansion in an increasingly global economy. Today, with a GDP of $18 trillion, China is a fierce competitor many see as a threat to the U.S. economy’s future prospects. This presents new and complicated challenges for many U.S. companies and the potential for a resurgence in domestic growth if more manufacturing is moved away from China and brought back to the U.S.
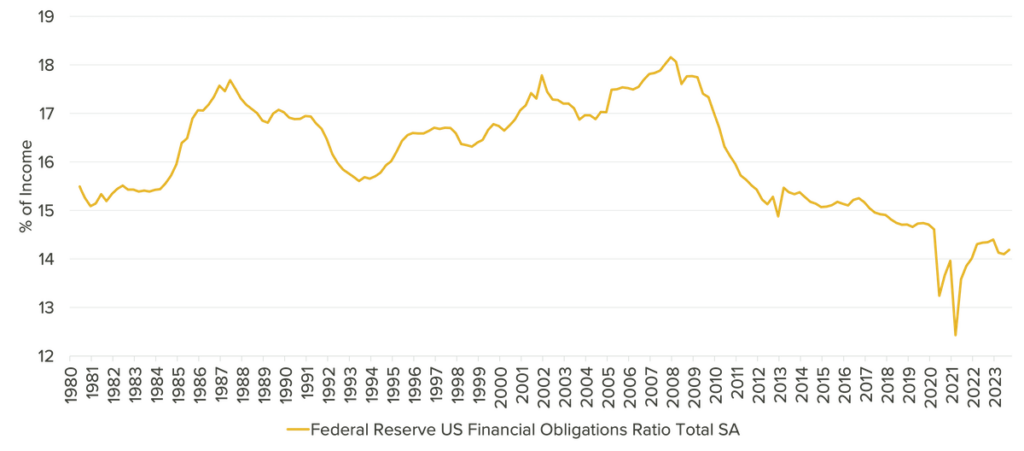
Consumers’ financial health is better than nearly ever. U.S. household debt payments as a percentage of income are the lowest in decades (apart from during the pandemic) and far lower than in the mid-to-late-1990s (see Exhibit 7). Consumers are extremely well-positioned to continue spending and investing and, we think, should continue to be as long as the job market remains healthy—even if interest rates don’t come down significantly.
On balance, the current environment appears to be more like the mid-’90s than it is different. That said, there are important nuances that will likely guide economic outcomes and have investment implications in the coming years.
Exhibit 7: U.S. Household Financial Obligations Ratio, 1980-2023
Source: Bloomberg, as of 9/30/2023
THE ROAD AHEAD
As noted, consumers make up about 70% of the economic activity in the U.S., which means their sentiments and actions will play an enormous role in the economy in the future.
One reason U.S. households are in such good financial health is that most of their debt (89%) is financed at fixed rates rather than variable rates. This fixed-rate debt includes mortgages, student loans, and auto loans (see Exhibit 8). That stability gives consumers a high degree of predictability around their debt payment requirements—which, in turn, gives them greater confidence about their capacity to spend.
Exhibit 8: Consumer Debt Outstanding, 2022: Fixed Rate vs Variable Rate
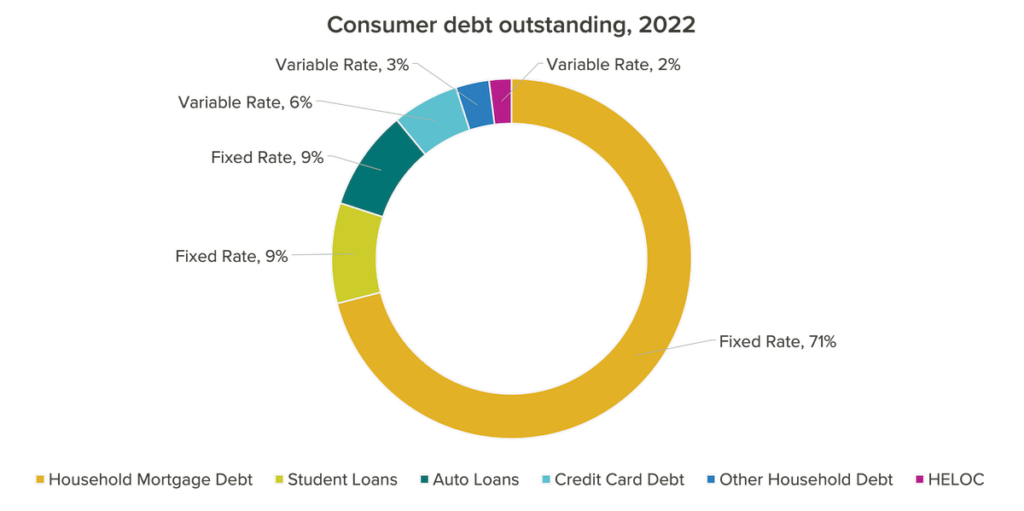
Source: FRBNY Consumer Credit Panel, Haver Analytics, Apollo Chief Economist, as of 02/01/2024
Meanwhile, both the economy and the jobs market—two big issues that voters will be focused on this election year—remain strong as we begin the second quarter of 2024. Example: While slightly down from their recent high, corporate profits remain robust. They’re higher than ever since 1965 (see Exhibit 9).
Exhibit 9: Corporate Profits (Non-financial companies only)
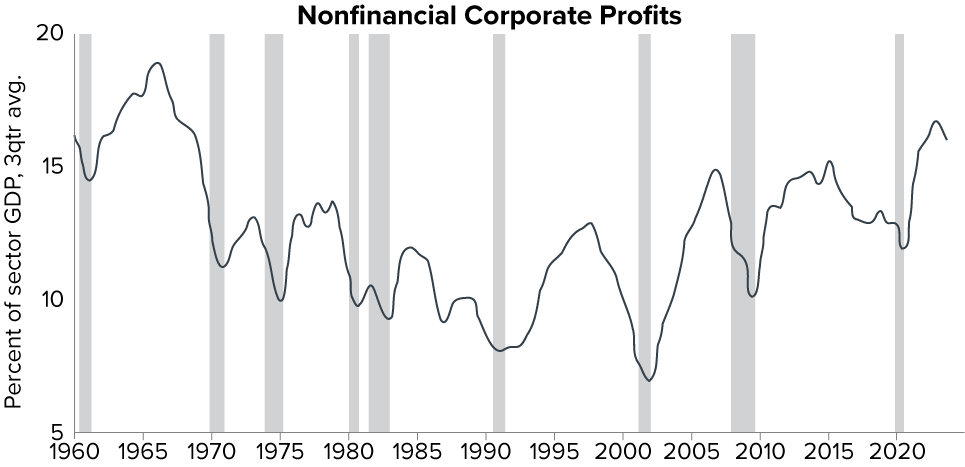
NOTE: We exclude the effect of pandemic-related transfers on NIPA profits in 2020-2021
Source: Department of Commerce, Goldman Sachs Global Investment Research
That said, consumers are still contending with an environment where the prices of milk, chicken, ground beef, and other staples of life remain 25% to 40% higher than pre-Covid (see Exhibit 10). While financial markets may focus on the fact that prices today are rising slower, individuals and families tend to notice that they’re paying much more now than they used to. Indeed, consumers who said their financial situation has worsened cited “higher prices” as the chief reason. The economy could suffer if such pessimism prompts consumers to pull back heavily on their spending.
Exhibit 10: Prices of Popular Grocery Store Items, 2020-2024
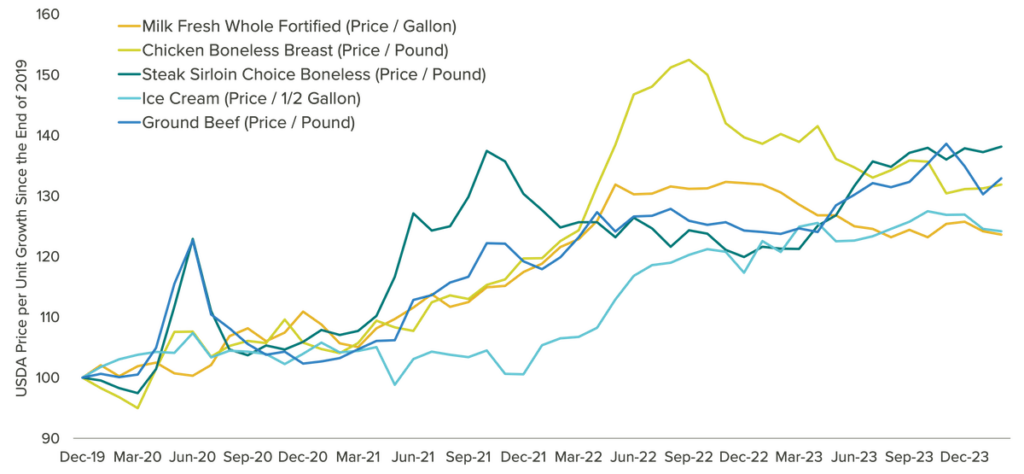
Source: Bloomberg, as of 02/29/2024
Perhaps the biggest question on investors’ minds today is when the Fed will cut interest rates. Going into 2024, expectations were for as many as seven rate cuts. Today, amid signs of stronger-than-expected growth and somewhat stickier-than-anticipated inflation, most Fed policymakers expect to cut rates just three times this year—and they now see fewer cuts in 2025 and 2026 than they once did. Overall, they envision interest rates in the longer run to be slightly higher than they projected last December.
The good news: Global Central Bank Rates (GDP-weighted) show peak interest rates have likely been reached (see Exhibit 11).
Exhibit 11: Global Short Rate (GDP-weighted) Shows Interest Rates Have Peaked
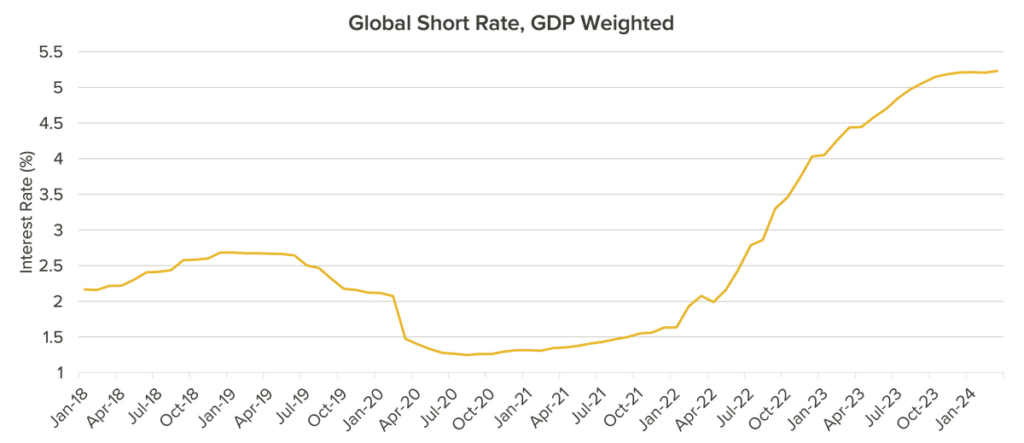
Source: Bloomberg, calculations by Horizon Investments, as of 03/29/2024
The issue of rate cuts—if, when, and by how much—depends on a few key factors. Chief among them:
- Inflation. While the falling rate of overall inflation has been welcome news for some time now, surprisingly high inflation readings during the first quarter have created what Fed Chair Powell calls “a bumpy road” toward the Fed’s inflation target of 2%. Some investors have even questioned whether three rate cuts this year are too optimistic, given recent inflation data 1.
- Wage growth. Payroll costs are the most significant expenses for most businesses. And while wage growth has moderated, some at the Fed argue that workers’ wages and other compensation remain too elevated for the overall inflation rate to hit the Fed’s 2% target. Exhibit 12 shows that the Employment Cost Index has been falling steadily—a good sign in the inflation fight, to be sure. However, we believe the Fed will want to see wage growth fall closer to 4% to feel confident that they’ve won the fight.
The good news: Fewer workers are quitting their current jobs (as seen by the falling quit rate in Exhibit 12), an encouraging sign that wage growth moderation is likely to continue. What’s more, immigration trends have played a significant role in supplying the U.S. with more workers to meet rising demand—and, therefore, have further helped to reduce upward pressure on wages.
Exhibit 12: Employment Cost Index and Quit Rate
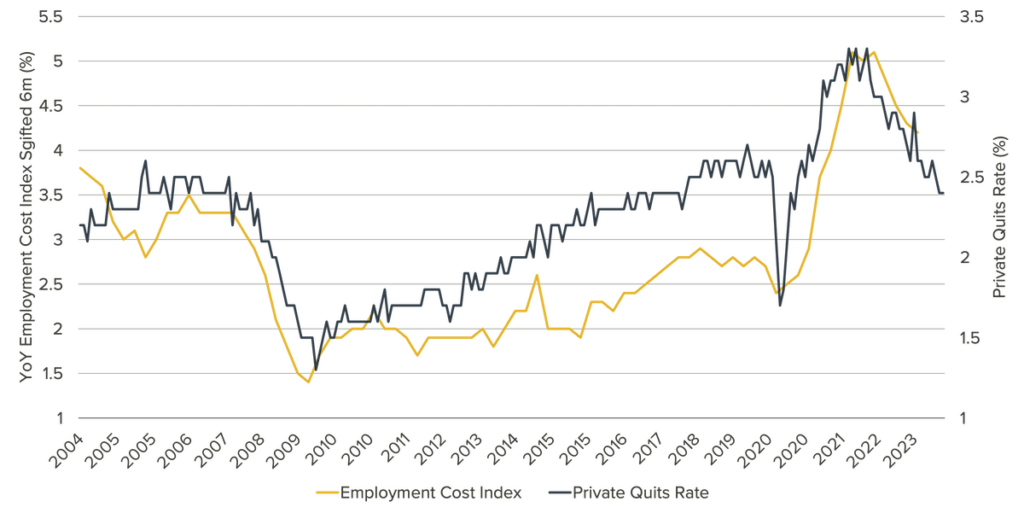
Source: Bloomberg, as of 03/31/2024
INVESTMENT OUTLOOK
On balance, U.S. equities appear well-positioned to build on their recent gains, as much of the momentum that has helped propel stock prices higher during the past two quarters remains in place. For example, as the first quarter ended, investors cheered developments such as:
- The U.S. economy grew in the fourth quarter more than previously reported.
- Consumer confidence rose to its highest level in nearly three years.
- Consumer spending in February rose at its fastest pace in 13 months.
- The corporate earnings recession of 2002 and 2023 is over. S&P 500 companies have seen two consecutive quarters of earnings growth, and are expected to grow again in the first quarter of 2024.
The biggest beneficiaries of these factors will likely be large-company stocks. As Exhibit 13 shows, future earnings estimates are significantly higher for S&P 500 companies than those in the mid-cap and small-cap areas of the market.
Exhibit 13: Consensus Earnings Estimates, Next 12 Months
Source: Piper Sandler, as of 03/14/2024
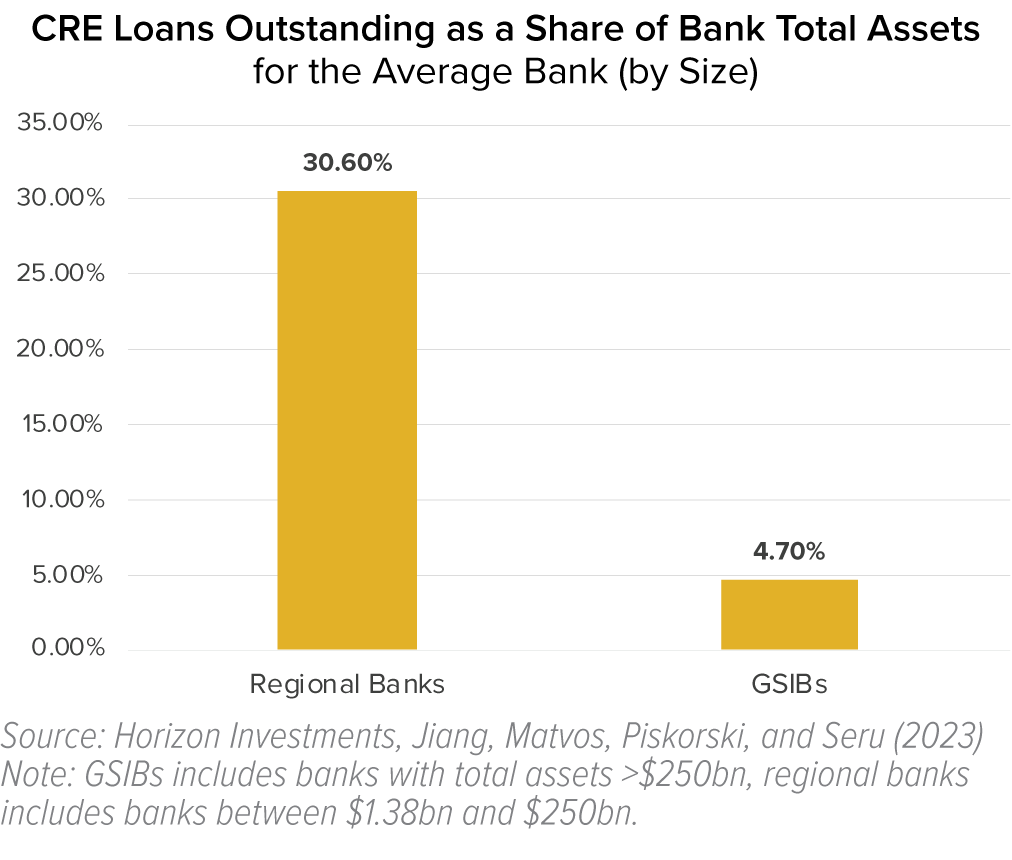
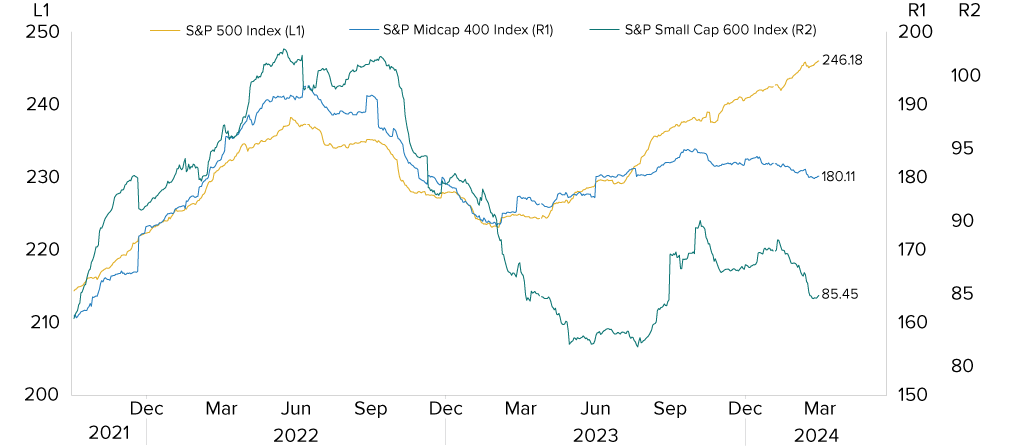
That said, we think small-company stocks are attractively valued based on their historical averages (as seen in the chart on the right in Exhibit 14) and are coming off a 19% return over the past two quarters. Smaller companies typically carry significantly higher amounts of debt than large companies, however (the chart on the left in Exhibit 14)—which could dampen small-caps’ prospects if interest rates don’t fall as quickly as expected or if rate cuts occur due to signs of a recession. Trouble in the commercial real estate market (see “Keeping a Close Eye on Risks in Commercial Real Estate” in the appendix) could also put pressure on small-caps.
Exhibit 14: Small-Caps: Attractively Valued But Highly Leveraged
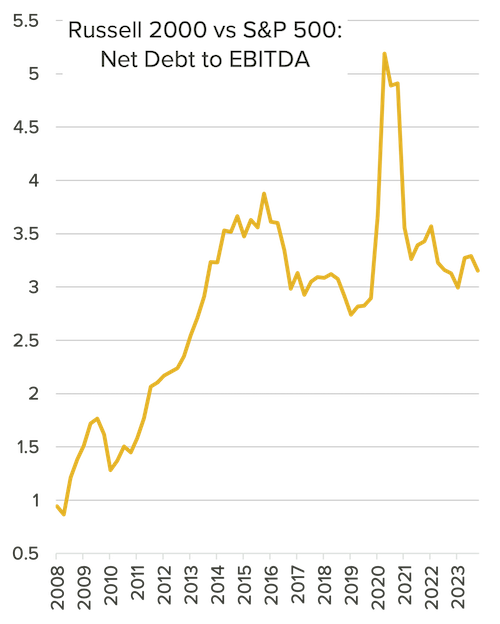
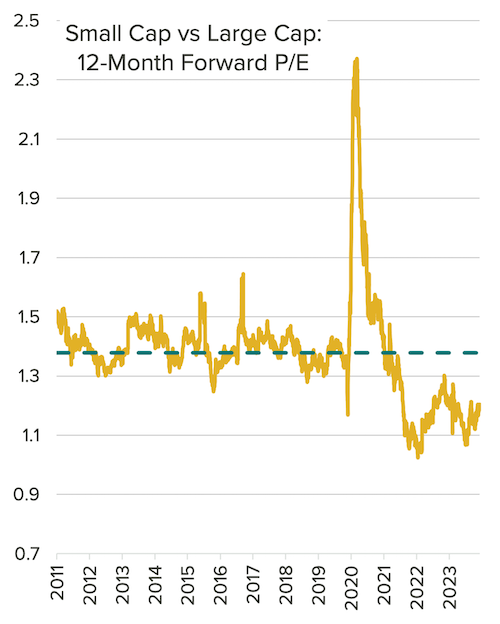
Source: MCSI, as of 3/29/2024
Overall, international markets offer less expected growth potential than the U.S. market today. However, we believe investments in foreign stocks remain an important diversification tool in equity portfolios. Historically, there have been multiple periods when international stocks as a group outperformed domestic shares—and the Japanese stock market’s recent outperformance, despite not having AI-based stocks to fuel its returns as the U.S. market does, is an excellent reminder of how foreign equities can benefit investors.
International stock indices are often less concentrated than U.S. peers. and can offer levels of exposure to various market sectors that differ significantly from U.S. indices.