
Historical Recessions
Given the increase in signs of a cooling economy, this study aims to explain what typically happens before and during recessions, answering the question – what constitutes a recession? While it is commonly cited that two consecutive quarters of negative GDP constitutes a recession1, the official arbiter does not strictly follow this measure. With this in mind, we can also measure economic trends around recessions to determine what data can be used as predictive indicators.
The National Bureau of Economic Research (NBER) determines a recession’s start and end dates by measuring aggregate real economic activity from a variety of monthly sources2: real personal income less transfers, nonfarm payrolls, real personal consumption expenditures, real manufacturing and trade sales, and household employment. The NBER also uses quarterly sources to define a quarterly turning point: real gross domestic product (GDP) and real gross domestic income (GDI). They do not explicitly state the weights that the various economic indicators have in their decision, meaning that recessions do not always have the same catalysts or economic causes. Table 1 briefly describes the cause of each post-war recession defined by the NBER.
Table 1: Recession Causes. A description of the catalyst of each postwar recession
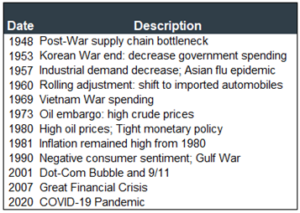 Source: Economic Data from the National Bureau of Economic Research.
Key Economic Indicators
All recessions are not created equal – Table 2 and Table 3 put some data behind this statement. Table 2 calculates six-month averages of inflation, GDP, and earnings growth of S&P 500 Index companies around recessions. As Table 2 shows, on average, inflation, measured by the Consumer Price Index (CPI), fell slightly during recessions. However, in exactly half of the recessions, inflation was actually either the same or higher than leading up to the recession. Additionally, half of the recessions began with inflation below 4.9%, and half above. By definition, we did see a consistent contraction in real GDP in all but one recession, and outside of 2020, roughly a 2% contraction in aggregate economic activity represented the direst scenarios. Finally, earnings growth, measured by the S&P 500 trailing twelve month (TTM) earnings (SPX), was low coming into recessions at just below 2% on average – and also fell consistently in all but the 1973 slowdown. Our conclusion – from a forecasting perspective, below average earnings growth precede most recessions.
Table 2: Economic Indicators Prior To and During Recessions
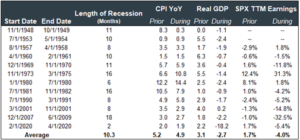
Source: Economic Data from Bloomberg. Calculations by Horizon Investments.
Economic activity contracts during a recession, but an economic contraction is not always coupled with a stock market decline. Historically, the stock market has peaked on average six months prior to the start of a recession and has typically bottomed an average of four months prior to the end. Practically, if the average recession last 10.3 months, this means the stock market has already started its recovery halfway through the economic pullback. On average, the stock market fell just over 4% during a recession, with the greatest pain occurring during the 1973 oil embargo and the 2007-2009 mortgage-induced financial crisis. In exactly half of post-war recessions, the stock market wasn’t down during the recession at all.
Table 3: Summary of Historical Recessions
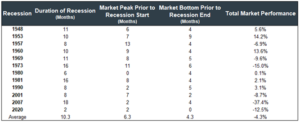
Source: Total Market is the S&P 500 Index from Bloomberg, calculations by Horizon Investments.
Warning Signs?
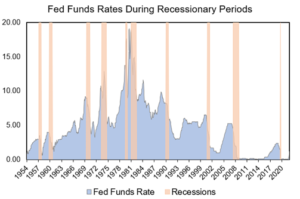
A yield curve inversion, when shorter-term yields are higher than longer-term yields, is likely the most cited indicator that precedes a recession. The yield curve has inverted an average of 15 months prior to the start of recessions since 1973. While the long end of the yield curve is often referenced as a measure of economic growth expectations, the short end of the curve is impacted by changes in the Federal Funds Rate; hiking rates often results in an inversion of the yield curve. The Federal Reserve has increased interest rates prior to every recession since 1954 (Chart 1).3
However, there is a problem with using yield curve inversion as a leading recession indicator: distinguishing between a potential false positive and a delayed arrival of the recession. False positives pose a problem with this indicator because there have been instances where inversion occurred but a recession period did not follow. For example, the curve inverted in June of 1998 with no recession soon thereafter. Yield curve inversions are also an inconsistent time indicator of recessions; some occur immediately after prolonged inversion while others have been delayed up to 24 months after the first point of inversion.
Chart 1: Rate Hikes Precede Recessions
Source: Economic Data from Bloomberg. Calculations by Horizon Investments.
Another commonly used recession signal is the Federal Reserve economist Claudia Sahm’s “Sahm Rule”. The Sahm Rule, detailed in a paper from 20194, suggests that when the three-month average unemployment rate rises by more than 0.5 percent relative to its previous twelve-month low, we have entered a recession (Chart 2). Sahm argues that both the rise in unemployment and the fact that unemployment typically peaks after the end of a recession indicate that unemployment cannot be used as a leading indicator but is a necessary condition for claiming we are in a recession. Though the Sahm Rule is in no way a predictive indicator of recessions and can lag anywhere from one month to six months behind the declared start of a recession, it has had a low rate of false positives; the measure has been consistent with the NBER’s identified recessions which makes it a strong coincident indicator.
Chart 2: The Sahm Rule Indicates Recessions
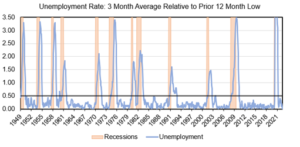
Source: Economic Data from Bloomberg. Calculations by Horizon Investments.
Because the Sahm Rule is a strong coincident indicator when applied to the unemployment rate, we were curious if the implications of the Sahm Rule align with other key recession inputs defined by the NBER. Using its same methodology to calculate pre-recession trends, we found that these economic indicators did not clearly predict an impending recession. Chart 3 shows that hiring is only marginally worse prior to a recession than in all other periods, but Personal Income and Consumption trends are actually stronger preceding recessions than in all other periods. Industrial Production, on the other hand, does deteriorate by a larger amount leading up to recessions. This average was driven by three recessions specifically (1953, 1957, 1960), and all were caused by production issues or sharp changes in demand (Table 1).
Chart 3: Sahm Rule Trends on Other Recession Inputs
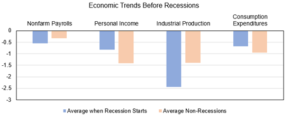
Source: Economic Data from Bloomberg. Calculations by Horizon Investments.
What does it all mean?
The key takeaway is that while economic activity contracts during a recession, that does not necessarily coincide with what is happening in equity markets. In fact, the stock market has been a consistent leading indicator; investors who jump in and out of the equity market due to recession fears could miss the early market recovery. To summarize other common conditions, here is what we found: since World War II, recessions have been preceded or accompanied by all major wars, generally low corporate earnings, an increase in the Federal Funds Rate, a yield curve inversion, and an unemployment rate increased by at least 0.5% as measured by the “Sahm Rule” trend. Examining other key economic conditions, we found no consistent pattern preceding recessions – concluding that trends in economic data are lagging indicators and not strong predictors of impending economic contraction.
Applying these takeaways to today’s market, we certainly have cause for concern given the Russia-Ukraine war, interest rate hikes, a yield curve inversion, and falling GDP growth – all of which preceded or coincided with prior recessions. However, strong second-quarter corporate earnings and a healthy labor market do not indicate a recession. With the consistent historical track record of the data points discussed, we do not believe we are currently in a recession. The consolation – if it is determined we are in a recession, the stock market pain is most likely behind us, and the stock market recovery may already be underway. Taking risks based on recession predictions isn’t something we do – and we don’t think investors should either. We believe keeping long-term goals in mind is a good way to stay on track during periods of economic and market uncertainty.
