
Room For Tech To Run?
History suggests that technology stocks may not be done delivering gains Tech stocks have once again been on a roll lately. The Nasdaq-100 Index is up 25% so far this

History suggests that technology stocks may not be done delivering gains Tech stocks have once again been on a roll lately. The Nasdaq-100 Index is up 25% so far this

Overview The artificial intelligence (AI) initial public offering (IPO) wave is arriving, and the offerings coming to market are unlike any in recent memory. SpaceX has filed its prospectus and

What Happened Last Week Historic IPO: SpaceX made history as the largest IPO ever when it began trading on Friday. Middle East Peace: News broke over the weekend of an


Robust employment numbers should support equity market strength The job market is crushing it these days. In May, the U.S.

What Happened Last Week Tech-Led Selloff: Tech stocks fell sharply on Friday, with semiconductors leading the decline. Hot Labor Data:

What to expect when SpaceX goes public next week SpaceX is set to go public next week in what’s predicted

What Happened Last Week Yields Fall: 10-year yields fell further as investors continued to eye an end to the crisis

The summer heat is on for equities Memorial Day kicked off the unofficial start to summer this week, and stock
What Happened Last Week Yield Relief: Last week saw rates fall modestly, helping the S&P 500 Index to an eighth

Shares of chipmakers are rallying this year While the AI spending boom is fueling big gains for lots of tech
What Happened Last Week Hotter Inflation: Last week’s inflation reports reflected higher energy prices, but were partially driven by lingering
Strong economic data is supporting the stock market Investors looking for the Fed to cut interest rates should probably adjust
What Happened Last Week Narrow Leadership: While the S&P 500 continues to notch new highs, gains remain concentrated in AI

Businesses are pumping out profits Corporate earnings season is in full swing. Last week alone, 44%* of the companies in
What Happened Last Week Earnings Drive Gains: A strong slate of earnings pushed the S&P 500 to new all-time highs,
Impressive returns from the S&P 600 These days, the S&P 500 is once again being driven higher by a limited
What Happened Last Week Tech-Fueled Rally: Tech stocks drove the S&P 500 to another week of all-time highs, while most

Tech-heavy index is on a tear After a long wait, tech stock investors have plenty to cheer about. It took
What Happened Last Week Tech-Fueled Rally: U.S. markets posted their best week of the year amid a sharp snapback in

Built to Last: The U.S. Economy’s Case for Resilience OVERVIEW The U.S. economy didn’t stumble into 2026 from a position

Apart from the current energy shock, prices are looking pretty good Late last week, investors were hit with news of
What Happened Last Week Ceasefire Optimism: The announcement of U.S. – Iran peace talks in Pakistan helped U.S. stocks to

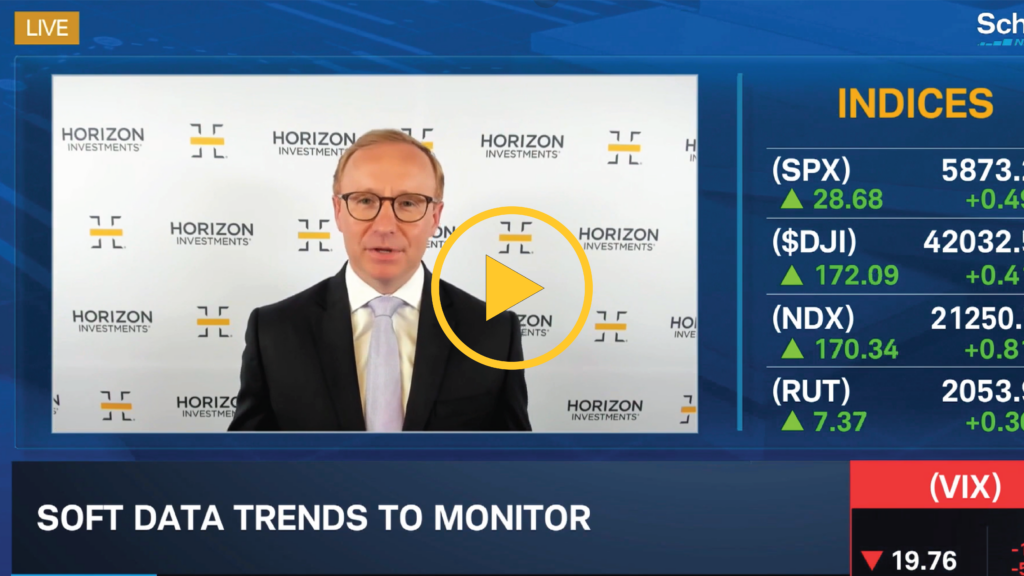
Watch the Replay Download Presentation
What Happened Last Week Oil vs Equity Divergence: Markets rallied last week on hopes that the conflict in the Middle

Keep your eyes on real yields for signs of the economy’s health Oil-driven inflation fears have investors increasingly convinced the
What Happened Last Week Energy Ultimatum: President Trump issued a deadline last Thursday for Iran to reopen the Strait of
Inflation fears have dramatically shifted investor sentiment After months of expecting the Federal Reserve Board to cut interest rates this
What Happened Last Week Energy Escalation: The U.S./Israeli coalition and Iran both ramped up strikes against energy infrastructure in the

Consumers and businesses are well-positioned to weather uncertainty One good reason to exercise and stay fit is to withstand an
What Happened Last Week Hormuz Remains Closed: The Strait of Hormuz remains closed to Western-aligned oil tankers. Capabilities Increase: Last

Oil price volatility surges as bombs fall in the Middle East Be ready for more wild swings in oil and
What Happened Last Week De Facto Hormuz Closure: Global oil supply was severely curtailed by increasing military action in the

Strong recent returns and a long-term case for portfolio diversification Emerging market stocks were up sharply last year, and they’re
What Happened Last Week Strikes on Iran: Over the weekend, a U.S.-Israeli coalition began heavy strikes against Iran, killing Ayatollah

Looking beyond tech for positive earnings surprises Investors’ sky-high hopes for technology companies are being met these days by a
What Happened Last Week Tariff Uncertainty Returns: After the Supreme Court struck down the administration’s justification for tariffs, President Trump

Much stronger growth than expected last month After a volatile 2025, the job market has started 2026 with some much-needed
What Happened Last Week SaaS-Pocalypse Now (Redux): AI disruption fears again led investors to sell first and ask questions later

Stock market returns are broadening out Technology stocks’ stranglehold on U.S. markets appears to be easing—a welcome development for stockpickers
What Happened Last Week Poor Sentiment: Volatility in crypto, stocks, and metals dampened investors’ risk appetite early last week. Legacy

A look at the precious metal’s plunging price Since last fall, silver has soared – up a whopping 148% from
What Happened Last Week Warsh Nominated: President Trump selected Kevin Warsh as the next Fed Chair nominee. Precious Metal Selloff:

Rising bond yields in Japan may boost costs for U.S. consumers and borrowers Yields on Japanese government bonds have surged
What Happened Last Week Trump Eases Threats: Markets staged a recovery as the President backed off his rhetoric about Greenland.

There’s plenty of money on the sidelines that could move into stocks Investors keep on building their cash war chest.
What Happened Last Week Breadth Expands: Cyclical and smaller-cap parts of the market continue to lead the major indices. Sell

The Productivity Payoff: AI’s Real-World Impact OVERVIEW As 2026 begins, the U.S. appears to be entering a new phase of

Affordability is moving in the right direction It’s no secret that the U.S. has suffered from a housing affordability crisis
What Happened Last Week Broad Stock Rally: Equities opened 2026 with a strong start, led by more cyclical parts of

https://youtu.be/1b8wcHEm_Hs Watch the Replay Download Presentation
What Happened Last Week Equity Broadening: Equities outside of the Mag-7 continue to lead their mega-cap counterparts. Venezuela Operation: U.S.

Economic growth could be stronger than previously expected Is the U.S. economy about to accelerate? The Federal Reserve Board seems
What Happened Last Week The Fed Delivers: The Fed delivered a 25 basis-point cut with a slightly hawkish tilt. Tech

Five of the “Mag 7” tech stocks are lagging the broader market Is a shift underway among today’s tech titans?
What Happened Last Week Procyclical Rally: Global stocks rallied, led by cyclicals and small caps as yields rose across the
A major rebound in investors’ expectations for lower rates With the federal government shutdown in the rearview mirror, an interest
Investors typically regard bonds as a safe haven because of their reputation for having lower risk and lower return profile.
What Happened Last Week Stocks Rebound: U.S. stocks rebounded sharply during the holiday-shortened week, reversing recent weakness. Fed Frontrunner Emerges:
What Happened Last Week Volatile Trading: Despite a great report, Nvidia shares reversed over 6% and led the market lower

Thousands of baby boomers are retiring or are already in their golden years, bringing billions of dollars out of retirement

Understand cryptocurrency’s unique traits before investing The roller coaster ride that is cryptocurrency investing continues. Since hitting an all-time high
What Happened Last Week Government Reopens: The government reopening induced a short-lived rally in risk assets. Hawkish Fedspeak: Fed speakers

Sales—a fundamental driver of corporate strength—are on the rise Stocks’ (mostly) steady march higher since April has some investors concerned
What Happened Last Week Sputtering Rally: Last week, investors reversed the recent strength in tech shares, turning against the stocks

A historic moment for the S&P 500 calls for investors’ attention Diversification is a core tenet of prudent investing. But
What Happened Last Week Earnings Strength: Strong tech earnings powered the S&P 500 and NASDAQ 100 to new all-time highs.

Treasury yields are takin’ it easy Volatility in the Treasury bond market has fallen to its lowest level in nearly
What Happened Last Week Earnings Week Two: Earnings continue to come in strong. Autos, aerospace, and bank names were the
Muddle, Bust, or Boom? Scenarios for the Economy and Consumers OVERVIEW The third quarter of 2025 reinforced the year’s defining

What’s driving the precious metal higher and higher? Gold has been shining brightly — and capturing the attention of many
What Happened Last Week Markets Rebound: Cooling trade tensions and strong earnings helped the market recover most of the prior

Strong fundamentals—not investors’ exuberance—are supporting this market The stock market’s recent string of new highs has investors wondering what comes
What Happened Last Week Friday Selloff: The return of tariff fears sent markets reeling on Friday, but markets modestly recovered

Market Review Equity markets continued to climb the wall of worry in the third quarter as investors weighed mixed economic

What Happened Last Week Fresh Equity Records: U.S. and international equities shook off the government shutdown to notch new highs.

U.S. households’ strong spending is keeping the economy chugging along Despite recent labor market weakness that has captured headlines, numerous
What Happened Last Week Equities Slide: The S&P 500 posted a weekly decline for the second time since August. AI

Can the small-cap surge continue? Small-cap stocks, represented by the Russell 2000, soared more than 2.5% following the Fed’s decision
What Happened Last Week Fed Cuts 25 Basis Points: The Fed lowered interest rates by 25 bps, with one voting

Would-be homebuyers are seeing lower mortgage rates Mortgage rates just dipped to a two-and-a-half year low—sparking hope that the slumbering
What Happened Last Week Oracle’s Blowout Report: A massive increase in its revenue guidance renewed optimism in the AI theme.


Another major revision to U.S. employment data The U.S. economy created 911,000 fewer jobs from April 2024 through March 2025
What Happened Last Week Yields Plunged: A weak jobs report helped push the 30-year yield to its biggest weekly fall
Guard against the negative, position for the positive While autumn officially begins in a few weeks, investors might have a
What Happened Last Week Nvidia Earnings: Nvidia reported strong earnings, but its forward guidance fell short of expectations, signaling slower

What might partial ownership by the Feds mean? The U.S. government is taking a 10% ownership stake in semiconductor maker
What Happened Last Week Jackson Hole: Fed Chair Powell opened the door to a September rate cut in his speech

The Fed is nearing a crucial decision As Federal Reserve Board Chair Jerome Powell prepares to speak at the Fed’s
What Happened Last Week Inflation Data: Tuesday’s headline Consumer Price Index (CPI) was in line with expectations, but Producer Price

Investors are cheering second-quarter results Corporate profits continue to impress and reassure investors. Now that over 90% of S&P 500
What Happened Last Week Federal Appointments: President Trump named Stephen Miran to be a temporary Fed Governor. Earnings Reports: Corporate

Big surprises that could spell trouble for the economy Employers are increasingly putting their “help wanted” signs back into storage.
What Happened Last Week Weak Payroll Data: Friday’s weak labor data and massive downward revisions for the prior two months

Momentum may be tested this week After bottoming out in early April in response to Trump’s first tariff announcement, the
What Happened Last Week Tariff Impacts: As earnings season rolls on, investors have found that tariff impacts on U.S. companies

The Confidence Gap: Strong Economy, Shaky Sentiment OVERVIEW U.S. stocks posted strong returns during the second quarter of 2025, but

Foreign demand for our financial assets remains strong There has been considerable concern lately that foreign investors are growing cold
What Happened Last Week Q2 Earnings: Earnings season kicked off with generally strong results, but the next two weeks are
If the first quarter of 2025 felt worse than it actually was, the second quarter made that disconnect even bigger.

The AI boom is also being driven by some old-school industries Last week, Nvidia—whose processors are a key driver of
What Happened Last Week Trade Headlines: The US announced new tariffs against Brazil, Mexico, the EU, and others, but pushed

What Happened Last Week All-Time Highs: Although shortened by the holiday, last week saw the major indices make fresh all-time

Man-made tariffs, then un-man-made, took markets on a wild ride this quarter After plummeting nearly 19% on tariff fears, the
What Happened Last Week All-Time Highs: Investor optimism on trade and the budget bill in DC sent the S&P 500

A rising supply of homes has the potential to bring relief to would-be buyers For years, Americans have lamented that
What Happened Last Week Middle East Escalation: Investors largely shrugged off rising tensions last week, assuming a weakened Iran will

Sentiment finally rises After months of feeling downbeat, consumers’ attitudes are perking up. The University of Michigan Consumer Sentiment index
What Happened Last Week Israel Strikes Iran: Israel struck Iran’s nuclear infrastructure and senior military leadership, leading to open conflict

Powell and co. are likely to sit on their hands for a while Fed watchers may want to consider taking

What Happened Last Week Labor Data: Friday’s non-farm payrolls report showed a slowing, but still a healthy labor market. Broadcom

Consider a goals-based investment perspective going into summer The old adage “April showers bring May flowers” proved true on Wall
What Happened Last Week Tariffs in the Courts: A trade court ruled that most of President Trump’s tariffs are illegal,

The timely importance of taking a differentiated approach to diversification Bonds these days are doing little to shore up investors’
What Happened Last Week Sell America: U.S. long-term Treasuries, equities, and the dollar all declined as investors sought shelter in


Some assets may have rallied too far, too fast Investors have breathed multiple sighs of relief in recent weeks as

Despite lower levies for now, uncertainty remains On Monday, the U.S. and China announced that they will temporarily suspend the
What Happened Last Week Markets Listless: Equity markets consolidated with notably lower volatility last week as investors digested the U.S.-UK

A lengthy run for the S&P 500 These days, the stock market is showing up on both the “best of”
What Happened Last Week Stocks Rally: The S&P 500 rallied for nine straight days to close above pre-Liberation Day levels.
Equity investors should look beyond the usual suspects these days This week marks the 100th day of President Trump’s current
What Happened Last Week Easing Fears: Equities rallied, led by the Mag 7, as tariffs, Powell firing fears, and DOGE-related
Market participants have fled dollar-based assets, leading to dollar weakness The U.S. dollar has experienced a sharp decline this year
What Happened Last Week Yields Stabilized: Despite Trump’s consideration of firing Powell, 10-year yields declined, supported by several solid Treasury

Although uncertainty remains, perpetual market swings may be less frequent While still higher than what Wall Street would prefer, market
Gain Strategies The first quarter was one of volatility and investor whiplash that felt much worse than it was, although
What Happened Last Week Equities: The S&P 500 surged 5.7%, yet frequent trade policy reversals, weak confidence, and a lack

Short-Term Market Volatility Market volatility over the past week has been nothing short of historic. The two-day loss in the

What Happened Last Week Tariff Shock: Trump’s huge tariffs—a 10% baseline already in effect and the “reciprocal” tranche to be

The power of diversification has been on display throughout 2025 Headline after headline this week highlighted that stocks posted their

Tariffs are taxes and taxes slow economic growth. The Trump administration’s newly announced tariff policy represents a ~$600 billion tax

What Happened Last Week Tariff Impact: Equity markets declined following Trump’s announcement of 25% auto sector tariffs, pushing U.S. tariffs

History suggests a rebound could be in order The market’s smaller stocks are down—and it may be time to pick
What Happened Last Week Equity Consolidation: Intra-equity market volatility was calmer last week after a few weeks of sharp investor

The shift in market leadership continues The uncertainty weighing on stock prices lately has hit many of the market’s highest
What Happened Last Week Market Correction Signals: S&P 500 falls for a fourth week—one of the quickest corrections in 75

Recent stock market losses are not as bad as they may seem Last week saw the S&P 500 have its
What Happened Last Week U.S. Sell-Off: Weak investor sentiment drove the S&P 500 to its third weekly decline, while the
Join Scott Ladner, Chief Investment Officer, and Austin Fitch, CFA®, Head of Consulting Solutions on Monday, March 10 at 10:00

Consumers may be tapping the brakes on their spending The outlook for the U.S. economy took a hit recently—and investors
The President Trump Seesaw: A Post-Inauguration Review of the Markets Over the last several weeks, President Trump’s White House and
What Happened Last Week Sentiment Souring: Policy uncertainty is likely contributing to the deterioration in animal spirits. Slowdown Fears: Investor

The U.S. has been lagging Europe and China in recent months. It seems “America First” doesn’t apply to the financial
What Happened Last Week Equity Sentiment Falls: S&P 500 hits new all-time highs but small-caps and retail darlings suffer big

Uncertainty is spiking, but optimism remains strong. The White House’s sweeping, and sometimes see-sawing, economic policy announcements on tariffs and
What Happened Last Week Tariffs: Markets welcomed Trump’s tariff delay, but skepticism raises the risk of more aggressive action down

Earnings have been much better than expected thus far among the market’s small companies. Large-company stocks have outpaced their small-cap
What Happened Last Week Policy Uncertainty: Investors welcomed a delay in tariffs on Canada and Mexico. Sentiment Support: A weaker

New import taxes on China, while Mexico and Canada get a reprieve for now. The trade war has started—albeit with
What Happened Last Week DeepSeek Dip: Tech stocks plunged due to fears of overinvestment in AI infrastructure following DeepSeek’s model

What does Nvidia’s historic rout mean for investors? The bad news: AI darling Nvidia lost $593 billion in market capitalization
What Happened Last Week Dollar Decline: The dollar had its worst week in a year as no “day one” tariffs

Will Trump’s tariffs push the greenback even higher? The U.S. dollar has risen sharply in value versus other world currencies
What Happened Last Week Lower Rates: Downside inflation surprises in the U.S. and U.K. and dovish Fed comments fueled a

OVERVIEW Stocks posted mixed results during the fourth quarter of 2024. Investors were initially encouraged by positive economic news and

Will the U.S. economy’s growth machine keep on humming? Surging bond yields are rattling investors, fueling concerns that stocks may
Gain Strategies The choppy, volatile market environment continued in the final quarter of 2024. Still, in contrast to the
What Happened Last Week Global Selloff: Stocks fell as rising yields and rate uncertainty pressured equities. Economic Strength: Strong jobs

Do top-heavy markets eventually spread out? Many investors have experienced extraordinary stock market gains over the past two years, with
What Happened Last Week Santa Rally Fizzles: The S&P 500 closed the week ~2% below its levels before the Fed’s
What Happened Last Week Hawkish Cut: The Fed cut 25 bp and pointed to a pause in their cutting cycle

Small-cap stocks may offer tactical opportunities. Investors who expect a late-year, post-election rally in small-company stocks may need to be
What Happened Last Week Equity Reprieve: U.S. large-cap gains paused last week despite a rally across the mega-cap growth complex

The digital currency seems to have the wind at its back these days. An ongoing post-election surge drove Bitcoin’s price
What Happened Last Week Fresh All-Time High: S&P notches another ATH, supported by mega-caps. Price Action: A weaker dollar drove

Opportunities outside of the top performers. It’s no secret that a small number of stocks in the S&P 500 have
What Happened Last Week All-Time Highs: Both domestic large- and small-caps hit fresh all-time highs over the holiday-shortened trading week.
What Happened Last Week Stocks Rose: S&P 500 closed within a hair of all-time highs on the back of easing

Positive earnings surprises are back on track. With more than 90% of the companies in the S&P 500 index reporting
What Happened Last Week Price Action: Headline equities sold off as investors digested marginally hawkish Fed commentary and Trump’s cabinet

With election results finalized, investors take a breath. The election is over—and financial markets are breathing a huge sigh of
What Happened Last Week Republican Election Sweep: Republicans granted a strong mandate to pursue an ambitious policy with Trump’s decisive

Investors saw sharp market movement the day following the election Donald Trump and the Republicans outperformed expectations on Election Day,

Stocks have had a habit of gaining ground no matter who becomes President. Regardless of which candidate emerges victorious, historically,
What Happened Last Week Yields Rose: Concerns over higher spending in the U.S. post-election caused yields to spike, dampening equity

Buyers need lower rates to get back in the game. In anticipation of the Fed’s rate cut last month, more
What Happened Last Week Yields Pushed Higher: Talk of fiscal worries added to the existing upside momentum for U.S. yields.

Consumer spending, corporate earnings, and the overall economy remain robust. Investors will examine one of the last snapshots of the
What Happened Last Week New All-Time High: S&P 500 notches new all-time highs and posted gains for the sixth consecutive

OVERVIEW Stocks posted another quarter of positive returns — despite some significant volatility along the way—with several equity market indices
The stock market is two years (and counting) into a bull market. Last Saturday marked the second anniversary of the
What Happened Last Week Price Action: Fresh all-time highs in U.S. large caps on bank earnings and re-kindling of the
Gain Strategies Despite returns of over 5% for both global stocks (MSCI All Country World Index) and core bonds

Lowest spreads in nearly three years Want more evidence that the U.S. economy is in good shape? Just take a
Chief Investment Officer Scott Ladner and Head of Consulting Solutions Austin Fitch, CFA®, review the third quarter of 2024 and
What Happened Last Week Geopolitical Volatility: Oil soared over 9% as investors weighed Israeli retaliation against Iran’s energy infrastructure. U.S.

It’s been 17 years since we’ve seen a weekly return this strong Long-suffering Chinese stocks broke out of their doldrums
What Happened Last Week China: Property market support was announced over the weekend in major cities in addition to the

Which sector has been leading the rally so far in 2024? One market sector has outperformed all others so far
What Happened Last Week Fed: Equities rallied as the Fed cut 50 bps to kick off its rate-cutting cycle, guiding

What Happened? The Federal Reserve (Fed) started their much-awaited easing cycle on Wednesday after holding their target rate in the

Are you ready? All eyes are on Jerome Powell on Wednesday as investors await the Federal Reserve Board’s near-certain decision
What happened last week Stocks Rebound: U.S. large caps posted their best week of the year, up about 4% and

Successful investing doesn’t have to be a thrill ride. Anyone who has driven California’s Pacific Coast Highway or North Carolina
What happened last week Price Action: Poor September seasonality may be to blame for a more than 4% decline in

Join us at 4:00 PM ET on Tuesday, October 8, 2024, for Horizon’s Quarterly Webcast, hosted by Chief Investment Officer

Here’s how stocks may perform for the rest of 2024 As the fall harvest season begins, it’s a time of
What happened last week NVDA: Nvidia’s (NVDA) beat and raise was not enough to impress investors, resulting in a nearly

Fed Chair Powell tees up the long-awaited rate cut Fed Chair Powell said just about everything investors wanted to hear
What happened last week Powell Pivot: Chair Powell validated the market’s view that a rate cut is coming in September.

Best week of 2024 for the S&P 500 After a brief summer slump and a short-lived overreaction, stocks enjoyed their
What happened last week Market Recovery: S&P rallies to within 2% of its all-time high. Healthy Data: Strong retail sales,

U.S. company profits continue to impress. Earnings season is in the home stretch, with more than 90% of the companies
What happened last week Price Action: U.S. and global stocks ended the week practically unchanged despite Monday’s historic volatility. Carry
The S&P 500 fell 3% on Monday—its biggest one-day decline in nearly two years—amid growing fears that July’s slowdown in

Market volatility spikes—but how much should you worry about it? The first full week of August started with a bang:
What happened last week Price action: Summer liquidity, poor economic data, a less dovish than desired Fed, and positioning all

A growing number of stocks are having their moment in the sun Everybody loves a good comeback story: Seabiscuit. The
What happened last week Price Action: Small-caps continued to outperform year-to-date leaders, like the tech-heavy NASDAQ 100. U.S. Data: U.S.

Don’t read too much into harbingers of stock market doom and gloom Sometimes, it pays—literally—to look beyond what’s “obvious” to
What happened last week Equity Market Reversion: Small-caps outperformed mega-cap technology by a little less than 6% as year-to-date laggards

Overview Overall, stocks delivered another quarter of strong gains during the three-month period ending June 28, 2024. For the quarter:

Will softness in housing inflation, jobs, and other metrics prompt the Fed to act soon? Those long-sought-after Fed rate cuts
What happened last week Softening Economic Data: Cooler than expected inflation data weighed on interest rates; September rate cut now
Gain Strategies Global stocks continued their upward march in the second quarter, powered higher by continued economic resilience and

Chief Investment Officer Scott Ladner and Head of Consulting Solutions Austin Fitch, CFA®, review the second quarter of 2024 and
What happened last week Price Action: MAG-7 leads U.S. equity indices to fresh all-time highs as small-caps and large-cap value

Six more months! Six more months! Investors cheered as stocks ended the second quarter last Friday up 4.3%. . .
What happened last week Reversion Price Action: Year-to-date equity trends continued their reversal last week; small caps and internationals led

Is the seventh month of the year a stock investor’s best friend? While scorching temperatures continue to sweep across much
What happened last week AI vs. the Rest: Year-to-date equity trends reversed last week as small-caps led mega-cap tech; quarter/month-end

Are there potential opportunities beyond the handful of big stock market winners? The equity market has spent the better part
What happened last week All-Time Equity Highs: Another week of new highs for U.S. large-caps as Broadcom, Oracle, and Adobe

Falling bond market volatility could support equity prices. Investors looking for signs of what stocks may do next often turn
What happened last week AI Theme: NVIDIA (NVDA) rally to $3T in market capitalization vaults U.S. large caps to fresh

Potential homebuyers are hitting the brakes. What could that mean for the future? Would-be homebuyers are increasingly deciding to stay
What happened last week Revenge of the Meme Traders: Small-caps outperformed large-caps on resurgent trading in “meme-stocks.” Slightly Softer U.S.

Thanks to AI, it seems a bunch of people want Nvidia’s semiconductors. Is it Nvidia’s world and we’re just living
What happened last week Semis: NVDA’s “beat and raise” earnings report reignited the AI trade and propelled mega-cap tech to

Should investors consider opportunities in global stocks? We believe international stocks could deserve a place in many investors’ portfolios because
What happened last week Price action: China led on a green week for global stocks, ratcheting higher as Chinese policy

Are U.S. consumers ready to go more rounds? “When will the consumer finally crack?” is a question that seems to
What happened last week Price action: The S&P 500 rose higher and through key technical levels, recovering the majority of

Generating goals-based income with an equity-centric, globally diversified portfolio. Memo to retirees seeking sustainable spending power: Consider sticking with stocks.
What happened last week Earnings: Strong earnings from AI-exposed mega-cap technology supported a modest rally in US equities. Jobs report:

It’s a big week for news from corporate America. Earnings season is in full bloom, with roughly half of the

OVERVIEW Stocks during the first quarter of 2024 extended the rally that began late last year, with major market indices
What happened last week Stocks rose for the first time in four weeks on the back of strong earnings. Economic
Middle East conflicts shouldn’t derail the strong domestic growth story. Rising Middle East tensions caused oil prices to briefly spike
What happened last week Equities fell for the third consecutive week as rates continued to climb higher. Strong retail sales

Can economic growth tailwinds outweigh higher interest rates? Month-over-month retail sales for March topped economist expectations at 0.7%, with February
What happened last week Equities sank as the 10-year Treasury yield surged above 4.5%. Third consecutive upside CPI surprise pushed
Chief Investment Officer Scott Ladner and Head of Consulting Solutions Austin Fitch, CFA®, review the first quarter of 2024 and
Gain Strategies Global stocks put in another strong quarter to start 2024 as continued economic upside surprises, especially in

Can company profits exceed rising expectations? First quarter 2024 earnings season kicks off this week, on the heels of reports
What happened last week The second quarter opened with a whimper as stocks declined and the U.S. Treasury yield curve

First-quarter returns suggest the market may have more to give. Stocks went out like a lion in March, with the
What happened last week Holiday-shortened week ends 1Q 2024 – U.S. equities (S&P 500) rose over 10%, a strong (85

Derivatives can be effective when you know what you’re buying or selling. Covered call option strategies can be an innovative
What happened last week Dovish central bank policy meetings resulted in fresh S&P 500 all-time highs. Market leadership in the

Keeping a close eye on Treasury market volatility Volatility in the Treasury bond market is once again flirting with its
What happened last week Last week’s price action was choppy and lacked a cogent narrative. 10-year U.S. Treasury yields rose

Taking a tactical approach to “junk” bonds Yield-hungry investors eyeing an eventual Fed rate cut are moving into high-yield corporate
What happened last week Mega-cap tech underperformed the broad market and equal-weight indices as market breadth improved. The underperformance of

Prices of many services are heating up again. Last week, we learned that the Fed’s preferred inflation gauge—the core personal
What happened last week Stocks rose as mega-cap tech and theAI theme continued to propel equitymarkets to new all-time highs.

Eventually, many clients will rely on the nest egg they have accumulated and preserved to address their financial needs during

Do shares of non-U.S. companies deserve a place in your portfolio? With soaring U.S. stocks—and domestic tech stocks in particular—capturing
What happened last week Nvidia, now a $2 trillion market-cap company, crushed lofty earnings expectations and sent equities to all-time
What happened last week Hot inflation print pushed back the start of rate cuts; more importantly, longer-term interest rate expectations

Is stocks’ extended winning streak “an offer you can’t refuse”? The S&P 500 has now closed higher for 14 out

Zach reviews the 4Q23 earnings season, what Horizon anticipates from the Fed and interest rates this year, and how these
What happened last week A mega-cap-led rally lifted the S&P 500 above 5,000, a new all-time high. Interest rates continued

Robust consumer spending continues to support a strong economy. Last week’s impressive jobs data—employers added 353,000 new jobs in January,
What happened last week Stocks ended the week higher on a mix of very strong AI-driven mega-cap earnings and a

The economy and inflation are lining up as investors hoped they would. All eyes were on the Fed this week
What happened last week Economic growth remains hot with inflation cooling – the probability of a ‘soft landing’ or ‘no

It could be a great time to buy stocks. Here’s why. Investors celebrated last Friday as the S&P 500 notched

Navigating heightened market volatility and an evolving regulatory landscape has become the new normal for many financial advisors, all while
What happened last week Action-packed and holiday-shortened trading week underscored by new all-time highs across major US equity indices. Economic

“Sticky” shelter costs could keep overall prices uncomfortably high. While inflation’s steady march downward of late has investors (and the
What happened last week Magnificent-7 (“MAG-7”) mega-caps led the “broadening-out” trades’ outperformers (e.g. small caps). Benign December CPI & PPI

OVERVIEW Following a third-quarter slump, stocks roared back to life during the final three months of 2023. The S&P 500
Gain Strategies In a topsy-turvy year for investors and economists alike, 2023 ended on a high note with strong rallies

Value and growth index fund investors may be surprised by their returns last year. Investors commonly own both value and

Chief Investment Officer Scott Ladner and Head of Consulting Solutions Austin Fitch review the fourth quarter of 2023 and provide
What happened last week The S&P 500 snaps its 9-week winning streak to end Friday less than 3% from all-time
What happened last week 2023 set a high bar for 2024 market-wise, although new all-time highs are just a hair

REGISTER NOW Join Horizon’s Focus Webcast, hosted by Chief Investment Officer Scott Ladner and Head of Consulting Solutions Austin Fitch,

How are the “Magnificent 7” stocks really doing? Outperformance isn’t always exactly what it seems to be. Many investors this
What happened last week Last week was a full macro week with a string of positive surprises that drove a

Some crucial context on Americans’ “out of control” debt levels. “Credit Card Debt Crisis” “Credit Card Debt Hits New Record”
What happened last week The S&P 500 has rallied for its sixth straight week, retracing back to 1Q ‘22 levels.

Most stocks have been laggards this year, but that could be starting to change. It’s no secret that a minute
What happened last week A strong seasonal rally is in full swing as the S&P 500 posted its best month

Will December bring glad tidings to small-company stocks? Small-cap stocks have had quite the slog this year. Punished by rising
What happened last week A short trading week saw the S&P 500 inch toward an all-time high. Short covering starts

One active approach to risk management is currently beating the market. Risk management can be an important component of goals-based
What happened last week Risk sentiment increased last week, lifting the S&P 500 through key technical levels as Treasury yields

The end of Fed rate hikes suggests good things for equities. The stock market’s surge last week—U.S. and global equities
What happened last week Risk sentiment increased last week, lifting the S&P 500 through key technical levels as Treasury yields
Three years of less-than-stellar financial market performance. It’s been a tough slog for investors over roughly the past three years,
What happened last week Investors reduced market exposure due to geopolitical tensions weighing on equities for the second week in

GDP growth over the past three months may have been huuuuuge. Third-quarter GDP growth could be a monster. True, it’ll

House hunters are facing a shocking number these days. Pity today’s homebuyers who are looking at an average monthly mortgage

OVERVIEW During the third quarter of 2023, investors hit “pause” on the rally that had lifted stocks higher for much
What happened last week Stocks and bonds sold off as geopolitical tensions outweighed strong economic and fundamental data. Long-end Treasury
Gain Strategies After a surprising and surprisingly positive first half of the year for financial markets, the recovery from the
What happened last week Stocks close the week higher despite mounting geopolitical concerns and rising long-term interest rates. Bond market
https://www.horizoninvestments.com/wp-content/uploads/2023/10/Q3-Webcast-Super-TB-Small_1.mp4 Chief Investment Officer Scott Ladner and Managing Director of Consulting Solutions Austin Fitch review the third quarter of 2023
What happened last week Stronger economic data and domestic political turmoil contributed to a resumption of the bond sell-off. Stocks

It’s been bleak days—and lots of them—for bond investors. As the fourth quarter begins, bonds are on track for a

Over the summer months, Horizon conducted the firm’s first annual Advisor Sentiment Survey to gauge opinions and expectations around the
What happened last week Last week, the quarter ended with both stocks and bonds mainly in the red. Long-end Treasury

The greenback’s recent rally could have legs. The U.S. dollar is lighting up the charts, rallying for the past ten
What happened last week A more hawkish than expected Fed meeting saw higher interest rate projections in 2024 and beyond.

Next-generation investing in AI will take hold in 2024 CIO Scott Ladner joined BNN Bloomberg to discuss the upside in

Falling interest rate volatility in Treasuries could herald a stock market rally. There are few things that make investors happier

https://youtu.be/mWhUrUv0Ffo?feature=shared Hear Zach cover what Horizon is taking from recent economic data, our expectations for Fed and monetary policy, and
What happened last week Treasury yields continued to move last week higher on strong economic data. U.S. inflation came in

Sharply higher oil prices have the potential to re-ignite inflation. Last week saw oil prices hitting their highest point in
What happened last week Strong data drove Treasury yields higher and stocks lower in a holiday-shortened trading week. As China

Historically, the 9th month of the year hasn’t been kind to investors. “April is the cruelest month,” wrote poet T.S.
What happened last week It was a recovery week for equities as yield moves continued to dictate price action. Labor
What happened last week A choppy week in markets saw small recoveries for stocks and bonds. Fed Chair Jerome Powell
There are few signs of the economic struggles predicted at Jackson Hole last year. Attention will be focused on Wyoming
What happened last week The push higher in Treasury yields drove the third consecutive week of simultaneous losses in equities

Stock investors may want to brace for some bumps in the road. After months of gains and low volatility from
What happened last week Pressure building on the disinflation narrative as global bond yields surge and commodities continue their rally

A covered call strategy offers the potential for risk mitigation, current income, and outperformance. Innovative strategies to mitigate risk and
What happened last week Negative bond market developments likely drove the sell-off in equities Jobs report pointed to easing wage
https://youtu.be/e26Kr8v2gvg Head of Portfolio Management Zach Hill, CFA® covered why the Fed matters less today, takeaways from earnings season, and

Other market sectors are showing signs of life. The S&P 500 continued its winning streak in July and is up

What happened last week Stocks climbed as the Fed and European Central Bank (ECB) raised rates to 22-year highs Continued

Is the Fed’s battle to contain inflation finally done? The market seems to think so. Recent comments from multiple Wall
CIO Scott Ladner joined TD Ameritrade to discuss this week’s FOMC meeting and A.I.’s potential impact on sectors.
What happened last week Global stocks edge higher, led by the US, in a week characterized by slow and sluggish

The S&P 500’s lowest correlation level in years suggests outperformers and underperformers should emerge. Think the S&P 500’s low volatility

When was the last time a client asked, “What was my portfolio’s alpha?” You may encounter that question with institutions
OVERVIEW During the second quarter of 2023, several key equity market indices built on their gains from the prior three
https://youtu.be/etvuMLvXBAM Chief Investment Officer Scott Ladner and Managing Director of Consulting Solutions Austin Fitch review the second quarter of 2023
Gain Strategies After a furious and volatile start to the year for stock and bond markets, the second quarter provided

Will six months of returns cause you to forsake global diversification? While it’s true that “the market” is up for
What happened last week Equities sold off in volatile trading to start the third quarter Continued economic resilience drove Treasury
What happened last week Strong end to a strong quarter with the S&P 500 closing at its highest level since

Stock market volatility has fallen to multi-year lows? “Merrily, we roll along, roll along.” Those Stephen Sondheim lyrics pretty much
What happened last week Stocks sold off with small caps, value, and internationals leading losses as narrow market leadership continued

With the oldest baby boomers over eleven years into retirement and the oldest Generation X members just eight years away,

The housing market is the latest economic indicator to light up the charts? One of the key leading indicators of
What happened last week Increasingly positive investor sentiment boosted the S&P 500 closer to all-time high levels Fed delivers “hawkish

Does This Market Have Staying Power? Stocks escaped the bear’s grip. What comes next Investors cheered last week as the
What happened last week It was a quiet week, with recent trends reversing in favor of year-to-date underperformers like small-caps

The positive surprises in the labor market just keep on coming. Job creation in the U.S. continues to defy expectations.
What happened last week Friday’s strong labor market data defined the trading week. A bipartisan debt ceiling bill averted the

Is the fast-moving market moving too fast? Technology stocks generally hate higher interest rates. Tech companies often need ongoing access
What happened last week A debt ceiling agreement was reached, and will likely become law this week. NVIDIA earnings were

CIO Scott Ladner, and Managing Director Austin Fitch, CFA® discuss the debt ceiling debate, disinflation, equity allocations, and the current

Active management aims to navigate trends as they emerge—and fade We believe an active, dynamic approach to portfolio management can
What happened last week The market saw year-to-date highs in stocks despite a lack of progress on the debt ceiling

Apple is once again worth more than the entire Russell 2000 In Marvel movies, it’s common for one superhero to

Fear-inducing headlines are likely painting too grim of a picture. Silicon Valley Bank. Signature. First Republic. PacWest. Comerica. The list

Hear Zach Hill, CFA®, cover earnings season, Fed policy, and what Horizon is watching in the markets. https://youtu.be/27YkbeBM_yc

Investors seem to be a relatively calm, cool, and collected bunch these days—which may be a harbinger of stock market
Overview The idea that the financial markets “climb a wall of worry” by showing resilience in the face of significant

Identifying investment opportunities may take a sharper focus going forward Fears about banks’ financial health have dominated many investors’ thoughts
Gain Strategies Investors shifted among dominant themes numerous times in what was a volatile but generally positive first quarter of

What tools can investors use to fight longevity risk in retirement? Many retirees today probably remember the 1976 disco hit
There’s tech, and there’s the rest Investors in tech stocks these days are a wildly happy bunch. Everybody else? Not

Key Takeaways Investors require different outcomes from their investments, a one-size-fits-all passive approach is unlikely to work for everyone. Horizon

Here’s something we have only seen once in 20 years In a true study of contrasts, the tech-heavy Nasdaq 100

Scott Ladner and Austin Fitch discuss the Fed announcement and the current market and what they are watching.

Stocks stand to benefit if the Fed eases up on the brakes Continued concerns about the health of the U.S.

Bank woes raise questions about the Fed’s next move. Investors’ sudden hunger for U.S. government bonds has pushed yields to

Chip stocks have come out swinging to start 2023 In what could be a harbinger of things to come for

The U.S. real estate market has been flexing its muscles in recent weeks. Unexpected strength in the real estate market

U.S. stocks have clearly perked up so far this year. But now, two key market metrics show a heightened level

https://www.horizoninvestments.com/wp-content/uploads/2023/02/Fast-Take-Final-Video.mp4 Hear Zach Hill, CFA®, Head of Portfolio Management, cover Horizon’s thoughts on the state of the economy, Fed policy,

In the consumer market, high-quality products are identified as reliable, longer lasting, and are generally viewed very positively. Names of

In the wake of a bruising 2022, investors seem to have decided that “risk on” is where it’s at this

Expected interest rate volatility has fallen 28 points so far this year The financial markets are predicting less volatility in
Gain Strategies The final quarter of what has been a difficult year for asset owners finished on a positive note

Overview Financial markets suffered sizable—in some cases, historic—losses in 2022. Soaring inflation combined with an aggressive monetary policy response by

Investors eye foreign markets and like what they see. For more than a decade, international stocks have lost performance race

Put “protection” has come up short lately—but there’s a better way. Put options are often a go-to risk management strategy