

OVERVIEW
During the third quarter of 2023, investors hit “pause” on the rally that had lifted stocks higher for much of the year. The major equity market indices were down over the three months; although, they remain in positive territory year-to-date (see Exhibit 1).
Exhibit 1: Performance of Major Equity Market Indices, 3Q 2023 and YTD
Total Returns Across Major Equity Indices

For the quarter:
- The S&P 500 fell -3.3%.
- The Nasdaq 100 returned -2.9%.
- The Dow was down -2.1%.
- It was the first negative quarter of 2023 for all three indices.
Stocks fell as it became clear throughout the quarter that interest rates—rising as part of the Federal Reserve Board’s rate hikes aimed at taming inflation—will likely stay elevated longer than investors had anticipated or hoped for due to strong economic conditions. The Fed raised rates once during the quarter, in July, but opted to hold rates steady in September.
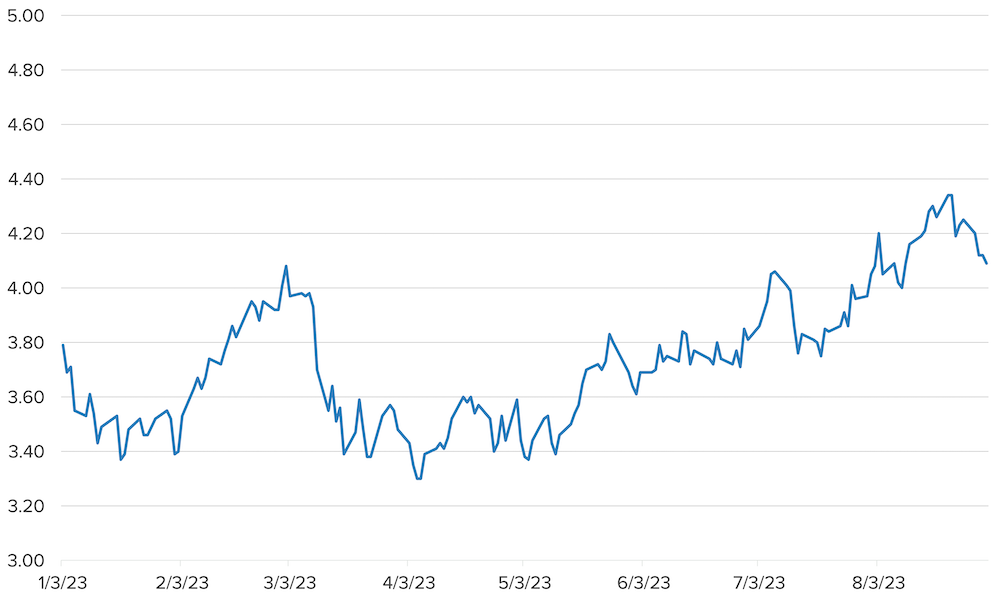
In that environment, the benchmark 10-year U.S. Treasury note yield rose to its highest level of 2023 (see Exhibit 2) and its highest level since 2007. Since bond prices fall as bond yields rise, the Bloomberg U.S. Aggregate bond index declined -3.2% for the quarter—the index’s third consecutive quarterly loss.
Overseas stocks also suffered during the quarter, with the MSCI All Country World Index down -3.4% and the MSCI All Country World ex US Index (which excludes U.S. stocks) down -3.8%. European stocks, represented by the MSCI Europe Index, returned -7.2%, while the MSCI Japan Index returned -1.6%.
Exhibit 2: Yield on 10-Year Treasury, 2023 YTD

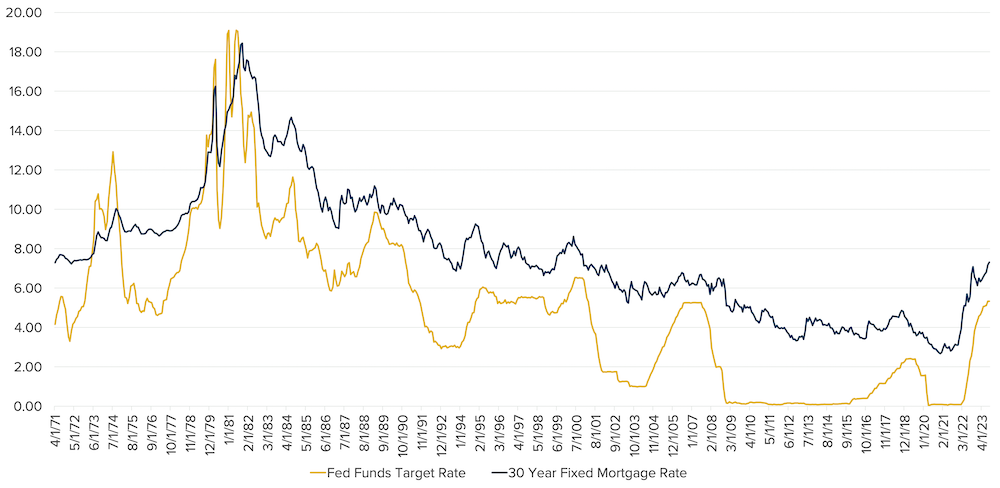
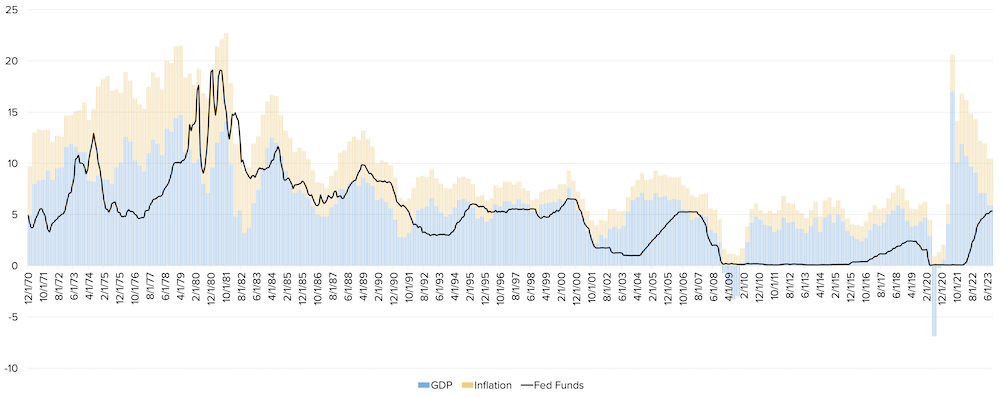
As the third quarter ended, investors, by and large, agreed that the Federal Reserve Board was either finished or nearly finished with its campaign of raising short-term interest rates to bring down high inflation. Since March 2022, the Fed has increased a key short-term rate, the federal funds rate (FFR), 11 times—bringing the FFR target range to 5.25% to 5.50%. Now, the thinking goes, we’ve reached the top of that cycle.
During that time, inflation fell from 9.1% in June 2022 to 3.7% in August. After the Fed chose to hold rates steady at its last meeting in September, Fed Chair Powell stated that Fed officials didn’t yet need to decide whether to raise rates again, that they would “proceed carefully,” and that they expect to keep rates around their current levels for longer into next year than they had previously predicted.
Opinions about how the economy and financial markets will behave in this “higher for longer” environment are decidedly mixed—primarily influenced by the perspective from which various investors view current conditions.
- An investor looking back over roughly the past 15 years—from 2008 to today—might reasonably conclude that today’s interest rates have reached abnormal heights and worry that these high rates could hurt spending and corporate profits enough to cause a recession.
- An investor looking back over the past 40 years or so would notice that today’s interest rates largely match those seen in the mid-2000s and much of the 1990s—periods of strong economic growth and stock market returns—and that current rates are far, far lower than those experienced during much of the 1970s and 1980s.
Exhibit 3: A History of the Federal Funds Rate and 30-Year Fixed Mortgage Rates
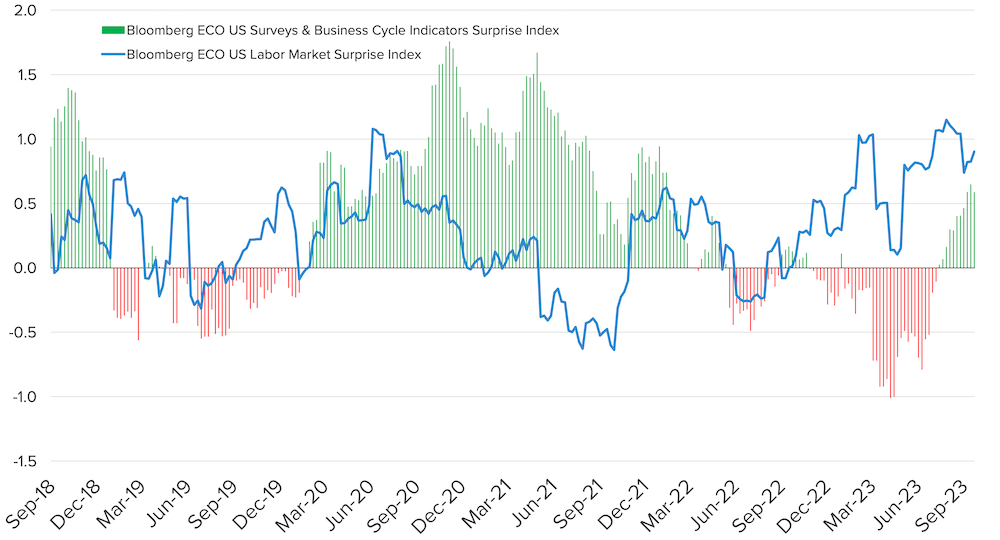
The U.S. economy has shown remarkable resilience in the face of rising interest rates, posting annualized growth in the second quarter of 2.1% with expectations of nearly 5% growth in the third quarter (according to the Federal Reserve Bank of Atlanta). As seen in Exhibit 4, labor market data has come in better than expected for an extended period now (the blue line), while the negative business cycle surprises we had seen for some time have turned a corner and are now in positive territory (the red and green bars).
Exhibit 4: Labor Market and Business Cycle Surprises Turn Positive
Consumers’ spending habits have largely been the driving force behind this resilient economy. Not surprisingly, investors are watching consumer attitudes and behaviors closely as they seek to determine whether consumers can continue to keep their foot on the economic gas pedal.
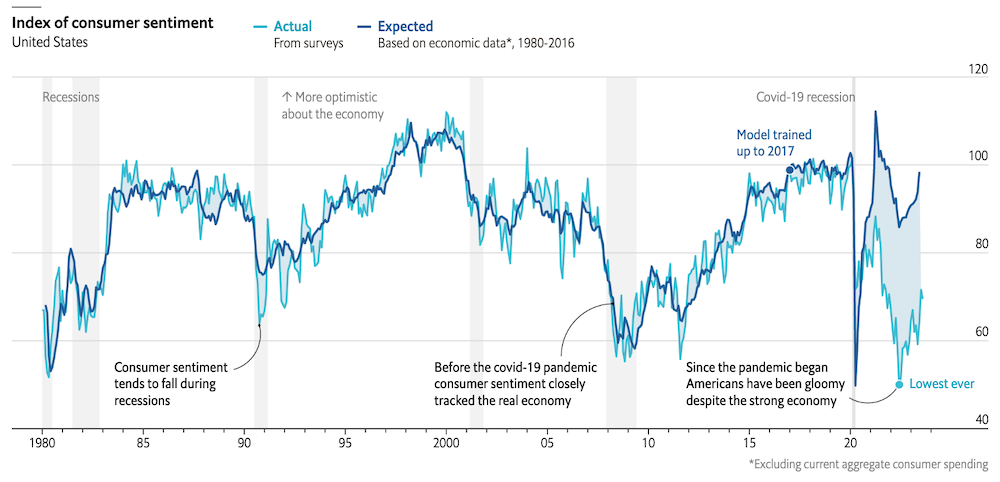
From one perspective, there is reason for concern. Consumer sentiment about the overall economy and people’s personal financial situations (shown in Exhibit 5) is hovering near the all-time low it hit in 2022—and right around the level it was at in the midst of the 2008-2009 global financial crisis that erased some $17 trillion of household wealth. Clearly, consumers are feeling very bad about current and expected future economic conditions—even though the economy remains healthy overall, as noted above.
Exhibit 5: Consumers Feel Horrible
Indeed, by several objective measures, there is little reason for consumers to have such negative sentiment. A perspective that looks beyond these self-reported feelings reveals a decidedly more positive picture of a strong consumer, willing and able to spend. For example:
- Consumer debt is at reasonable levels. Consumers’ nominal interest payments on their debt, as a percentage of their overall compensation from wages, is just 7.1%—near the lowest level since 1978 and on par with where it was pre-Covid. This low debt-to-compensation percentage strongly suggests U.S. consumers are very underlevered and can easily support their current interest payments.
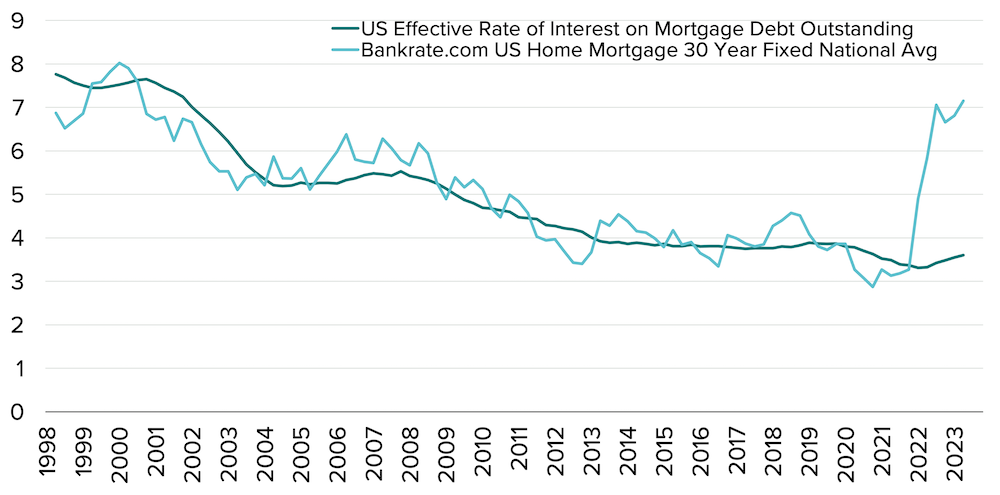
- Most homeowners have locked-in low mortgage rates. A key reason interest payments are manageable for so many consumers is that by and large, homeowners are paying between 3% and 4% on their mortgages (see Exhibit 6). While the Fed’s rate hikes have pushed the average 30-year fixed-rate mortgage above 7%, most homeowners today find their finances largely insulated from the impact of that spike.
Exhibit 6: Today’s Mortgage Rates vs Rates Most Homeowners are Paying
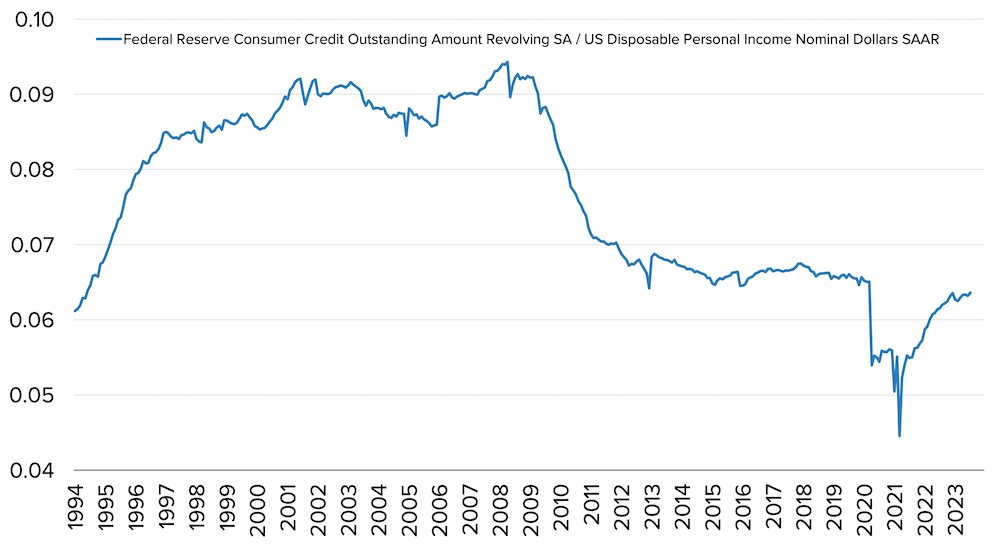
- Credit card debt remains under control—despite the headlines. Americans’ rising credit card balances have captured much attention this year. And, indeed, balances are up substantially: Consumer credit card debt topped $1 trillion for the first time ever earlier this year. From another perspective, however, the situation looks quite different. Exhibit 7 shows that outstanding revolving (credit card) debt relative to consumers’ disposable personal income is lower than before the pandemic—and far from the problematic levels seen going into the ’08-’09 financial crisis.
Exhibit 7: Consumers’ Revolving (Credit Card) Debt Relative to Their Disposable Personal Income
Through its words and actions, the Fed has resolutely communicated two key messages to the markets in recent months: It is done or nearly done raising interest rates and is unlikely to cut rates in the near term.
For example, members of the Federal Reserve Board have significantly lowered their 2024 unemployment expectations:
- Most Fed members in June were calling for 2024 unemployment of 4.4% to 4.5%. None predicted an unemployment rate below 4%.
- By September, however, the most common estimate was just 4.0% to 4.1%—with five members now looking for unemployment below 4%.
Other measures suggest that the labor market, while softening, remains healthy. The hiring rate, for example, has decelerated considerably—but a longer-term perspective shows that it has merely reverted closer to its historically normal levels (see Exhibit 8). Likewise, wage inflation also continues to normalize following their post-pandemic extremes (see Exhibit 9).
Exhibit 8: Hiring is Slowing – But Isn’t Slow
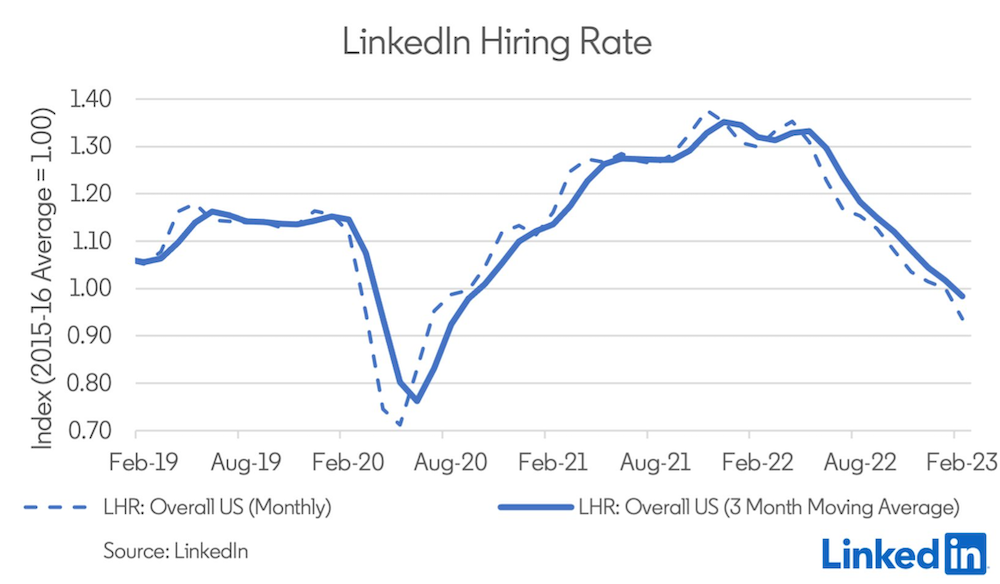
Exhibit 9: Wage Inflation is Normalizing
For investors, the ultimate question is: What do all these developments mean for financial markets in the coming months? The evidence we see suggests the following:
- The backdrop for equities is solid. Today’s combination of interest rates at their current levels, above-trend nominal GDP growth, and disinflation echoes periods such as the mid-1990s and the mid-2000s—both of which saw strong equity market returns (see Exhibit 10).
Exhibit 10: A History of Rates, Inflation and GDP
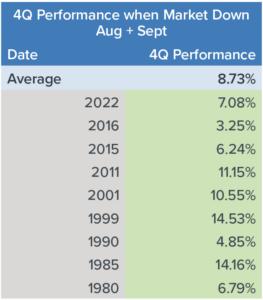
- Seasonal factors may set the stage for gains. Stocks fell in two of the three months during the third quarter—down -1.6% in August and -4.9% in September. It’s worth noting that September is historically the worst month for stocks: The S&P 500 has lost an average of 1.1% in September, dating back to 1928, and has risen less than 45% of the time over that period.
That said, the S&P 500 since 1980 has consistently delivered positive returns in the fourth quarter following those periods when both August and September were negative (see Exhibit 11). The index also tends to see its strongest gains during the fourth quarter—gaining 4.9% on average over the past three decades. (In contrast, third-quarter returns for the S&P 500 averaged just 0.2% over that period.)
Exhibit 11: For Stocks, a Bad August and September Could Mean a Strong Fourth Quarter
As is always the case, some risks could negatively impact these conditions and cause a change in our perspective. Some developments that we are closely watching include:
- Student loan payments. After multiple deferments, student loan payments will restart in October for 28 million borrowers. The average student loan borrower owes around $29,000, with all such debt in the US totaling more than $1.75 trillion. This has some investors worried about the potential impact on consumer spending, which fell significantly in September. One estimate suggests that the disposable income lost due to these loan payments could amount to 0.25% of GDP.
- Auto workers’ strike. As the quarter ended, the United Auto Workers strike was in its third week, and some estimates put the economic damage of the strike at more than $5 billion.
- A gas price spike. Energy goods and services prices shot up by 6.1% in August from July, according to the latest PCE inflation report released just before the end of the quarter. Prices at the pump rose 10.6% from July to August, making gasoline the largest contributor to inflation. Meanwhile, oil prices have marched higher over most of the quarter. If oil and gas prices spike further from here, it could damage consumer spending and corporate profit growth.
- Impact of higher rates on smaller companies. As noted in Exhibit 12 below, businesses are seeing some of their lowest net interest payments as a percentage of their after-tax profits in decades. But a closer look (see Exhibit 13) reveals that the smallest 50% of those companies are paying significantly higher interest on their debt than their larger peers—at rates close to 6%. That matters because small businesses employ 46% of all U.S. private sector employees. If these firms decide to cut their labor force due to higher costs, it could damage many Americans’ financial health—forcing them to rein in their spending.
Exhibit 12: Smaller Businesses are Paying Higher Interest Rates on Their Debt
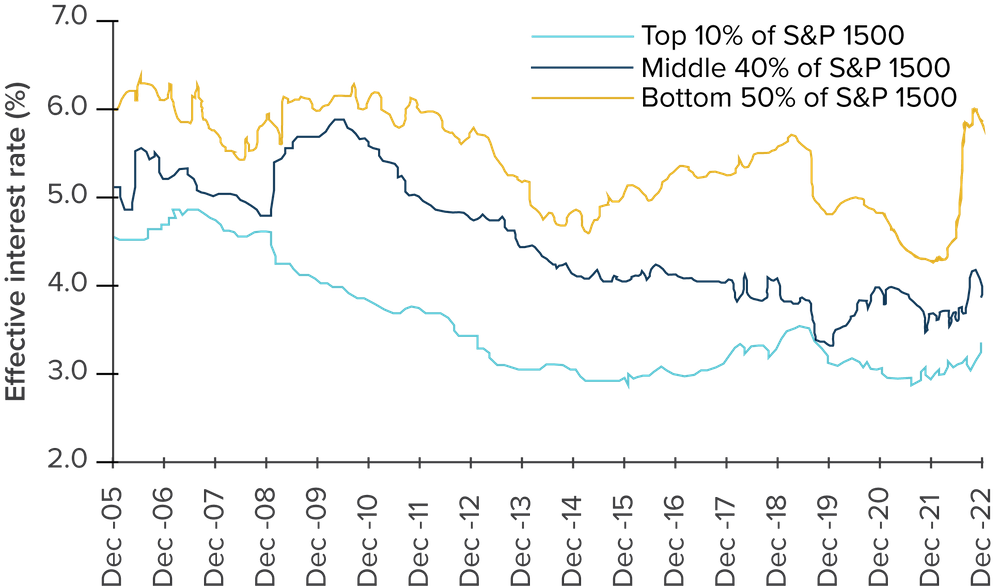
The S&P 1500® combines three leading indices, the S&P 500®, the S&P MidCap 400®, and the S&P SmallCap 600®, to cover approximately 90% of U.S. market capitalization. It is not possible to invest directly in an index. Information obtained from third-party sources is believed reliable but has not been vetted by the firm or its personnel.