
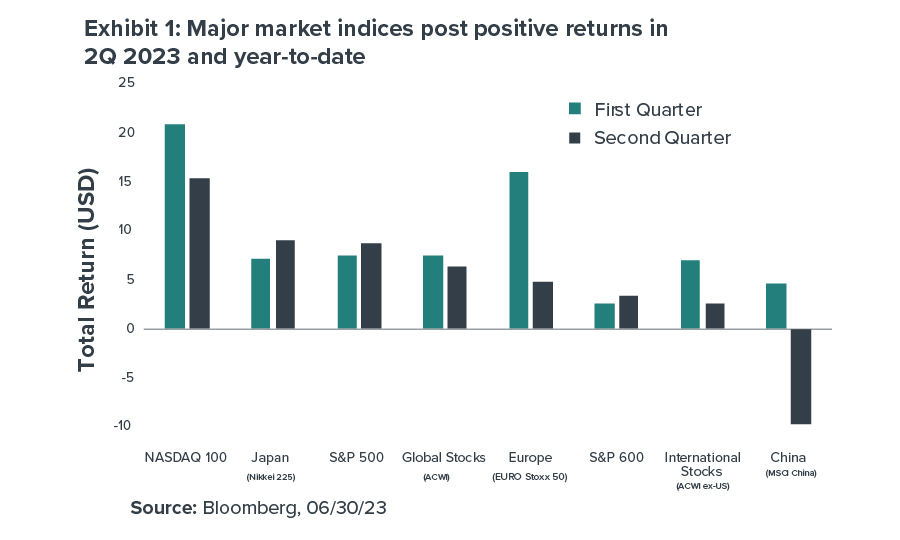
During the second quarter of 2023, several key equity market indices built on their gains from the prior three months (see Exhibit 1).
For the quarter:
- The S&P 500 rose 8.7%, its third straight quarter of gains and its biggest quarterly advance since the fourth quarter of 2021.
- The Nasdaq 100 returned 15.4% for back-to-back positive quarters.
- Global stocks1 were up 6.3%.
For the first half of 2023:
- The S&P 500 rose 16.9%, its best first half since 2019.
- The Nasdaq 100 surged 39.4% for its best first half on record.
- Global stocks1 rose by 14.1%.
Most notably, the S&P 500 index officially broke free of the bear market that had taken it down more than 25%. The S&P 500 ended the quarter up 24.4% from its recent low point last October, signaling a new bull market phase (although it was still 7.2% off the all-time high from January 2022.)
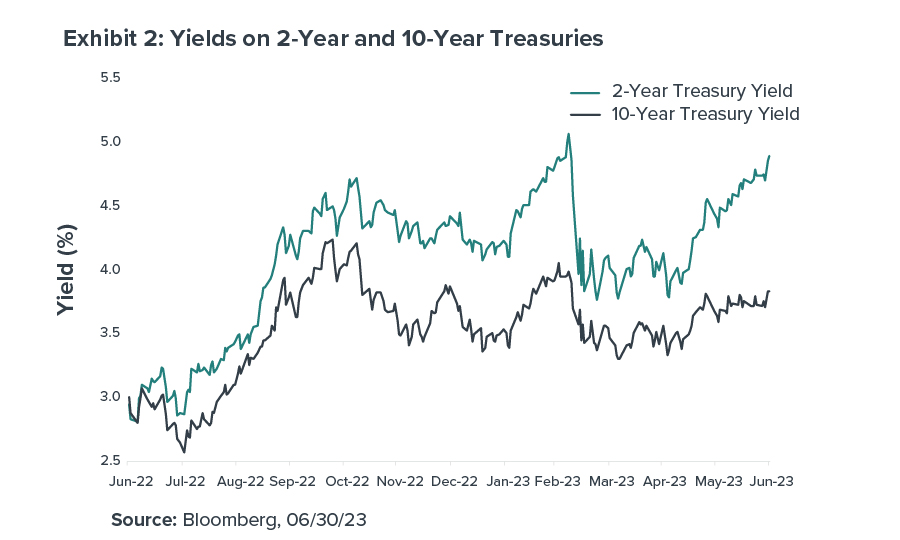
In the bond market, the Bloomberg U.S. Aggregate bond index fell 0.8% as bond yields (which move inversely to bond prices) rose. For example, the 10-year U.S. Treasury yield started the second quarter at 3.49% and ended it at 3.82% (see Exhibit 2). Meanwhile, the yield on the 2-year Treasury rose more sharply—from 4.06% to 4.88%.
Government bond yields rose due to factors such as continued interest rate hikes by the Fed, surprising signs of economic strength, the resolution of the debt ceiling debate, and a reduction in problems affecting regional banks (which eased investors’ fear of a potential credit and lending crunch.)
In April, the Federal Reserve Board continued its series of interest rate increases (which began in March 2022) meant to bring high inflation back down to the Fed’s target of 2%. In June, however, the Fed paused its rate hike campaign in order to better gauge its progress toward that 2% goal. By the end of the quarter, the Fed’s preferred inflation measure—the personal-consumption expenditures price index—registered its lowest year-over-year reading in two years (up 3.8%). Core prices, which exclude volatile food and energy categories, rose 4.6% in May from a year earlier (down slightly from 4.7% in April).
Overseas, Eurozone stocks posted gains during the quarter, despite concerns about inflation and slowing economic momentum. The gains were driven mainly by the financials and technology sectors, while energy and communication services underperformed. In Japan, the Nikkei index hit its highest level in 33 years as that country’s economy showed surprising strength. In contrast, Chinese stocks fell on signs of weaker than expected economic growth.
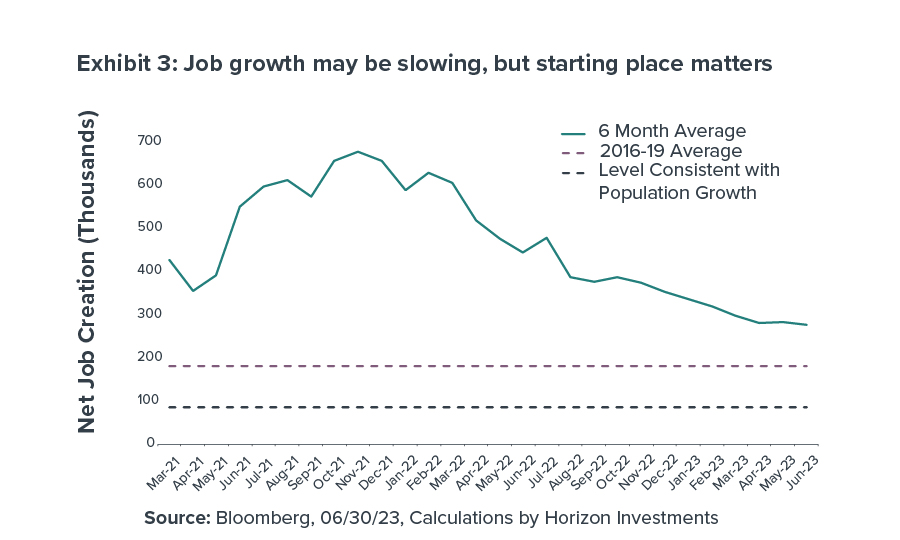
The strength of employment in the U.S. has been both consistent and consistently underappreciated by investors for some time now. During the second quarter2, for example:
- 253,000 new jobs were created in April—significantly higher than the 180,000 jobs that Wall Street expected to see.
- In May, new jobs created again topped expectations—339,000 actual versus 190,000 predicted.
- New job growth in June actually came in lower than expected, but still increased by a solid 209,000.
Bigger picture, actual jobs created outpaced estimates for 14 consecutive months through May. And while job growth shows signs of slowing, the slowdown is coming off of very high levels (see Exhibit 3).
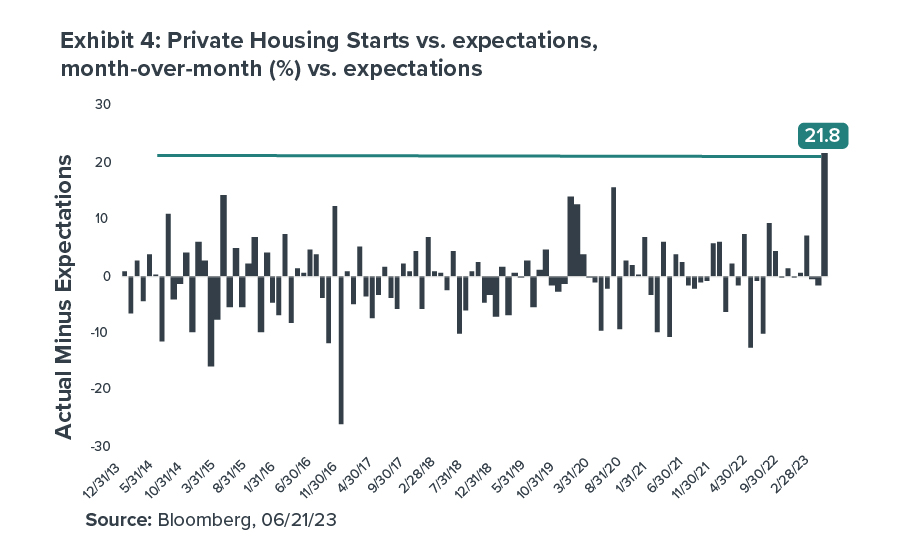
Despite higher interest rates, the housing market—one of the most rate-sensitive sectors of the economy—showed a level of resilience that took many by surprise. Case in point: Construction of new homes and apartments in May blew away expectations, with the pace of construction at its highest level in more than a year. The number of actual housing starts exceeded predicted starts by 21.8 percentage points—the biggest surprise to the upside in more than nine years (see Exhibit 4). Likewise, new home sales in May were up 12.2%—the biggest upside surprise since August 2022. A surge in the construction and sale of new houses likely means strong future demand for furniture, appliances, and many other things that fill those homes.
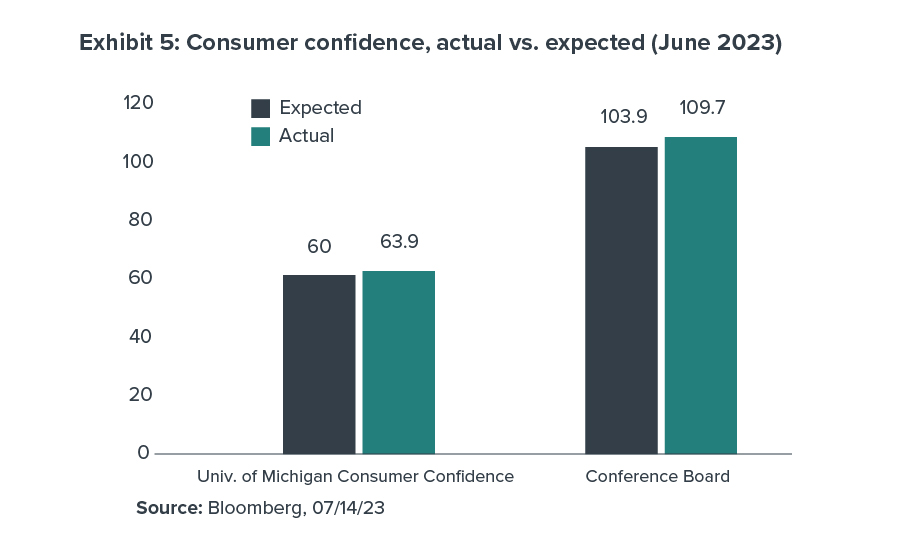
Given the amount of new job creation, it would make sense to expect that consumers are sanguine about the future. However, results of the two most widely-followed consumer sentiment surveys exceeded expectations as the quarter came to an end:
- The University of Michigan Consumer Confidence Index in June rose to 63.9, higher than the market expectation of 60. Consumers’ expectation for inflation looking one year ahead fell to the lowest level since March 2021.
- The Conference Board’s consumer confidence index hit 109.7 in June—the highest reading since January, 2022 and much better than the 103.9 reading that had been expected.
One of the major developments during the first quarter of 2023 was the failure of two large U.S. banks—Silicon Valley Bank and Signature Bank—which sparked fears of a global credit and lending crisis and a recession. The failure of another U.S. bank—First Republic—in the second quarter added fuel to those fears.
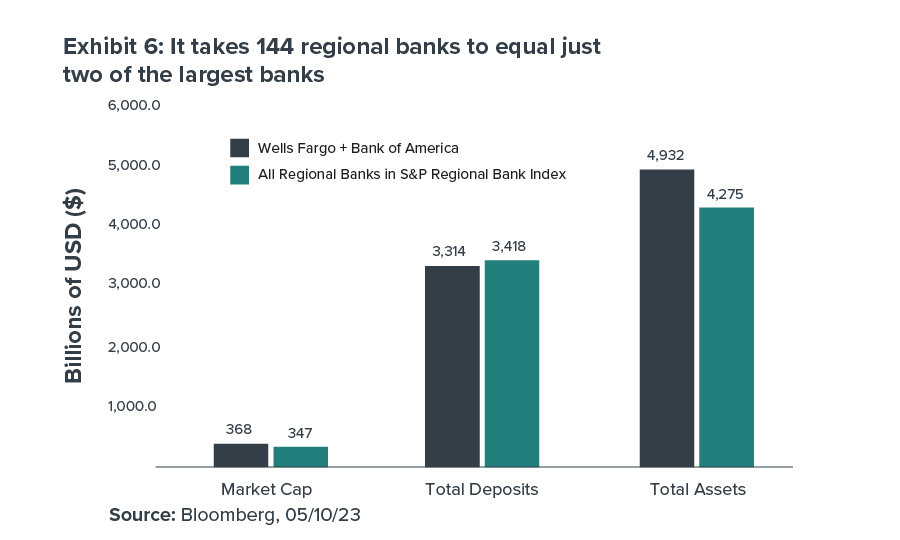
However, a widespread banking crisis never materialized in the wake of these regional bank failures. Our analysis (see Exhibit 6) told us that, collectively, all of the 144 regional banks found in the S&P Regional Banks Select Industry Index were about the same size in key metrics as just two of the country’s largest banks, Wells Fargo and Bank of America.
The market’s resilience during the second quarter in the face of concerns about the economy and corporate profits is a good reminder of the old adage that the financial markets tend to “climb a wall of worry” on their way to new heights.
The obvious question as we look to the second half of 2023 is:
Can stocks continue to climb that wall?
Here are some key factors we’re paying close attention to:
The job market is crucial. One of the biggest factors we are watching carefully is the job market, given how vital consumer spending and confidence have been to the economy and the financial markets. Job losses by themselves may not be especially worrisome given the strong labor market. More troubling would be signs that people are both losing their current jobs and not getting rehired at new ones quickly. We are monitoring the weekly continuing jobless claims data and comparing it to pre-Covid levels to get a read on just how much the job market is slowing down. Currently, it looks like we have come off the incredibly tight labor market levels we saw last year (which pushed wages to stratospheric levels) but that we are well within a healthy range that should continue to support consumer spending.
Consumer balance sheets are strong. Consumers today find themselves well positioned to deal with higher interest rates and a broad economic slowdown (should that occur). For example, based on the latest Fed Flow of Funds data, the asset-to-liability ratio of households is 8.6x, up from 8.0x at the end of 2019. In other words, during the last three-plus years of uncertainty in so many areas of life, consumers’ balance sheets actually improved (see Exhibit 7). That should enable many consumers to effectively navigate issues such as higher costs and rising credit card debt.
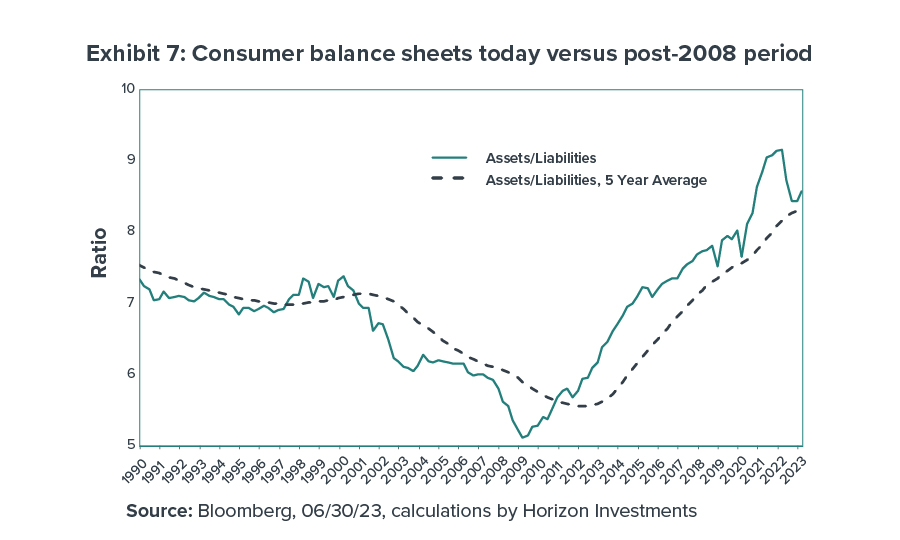
Contrast that to what happened around the Global Financial Crisis. Asset-to-liability ratios fell as housing prices were slow to recover and over-levered households tried their best to pay down debts despite a very weak job market. Today’s environment looks starkly different.
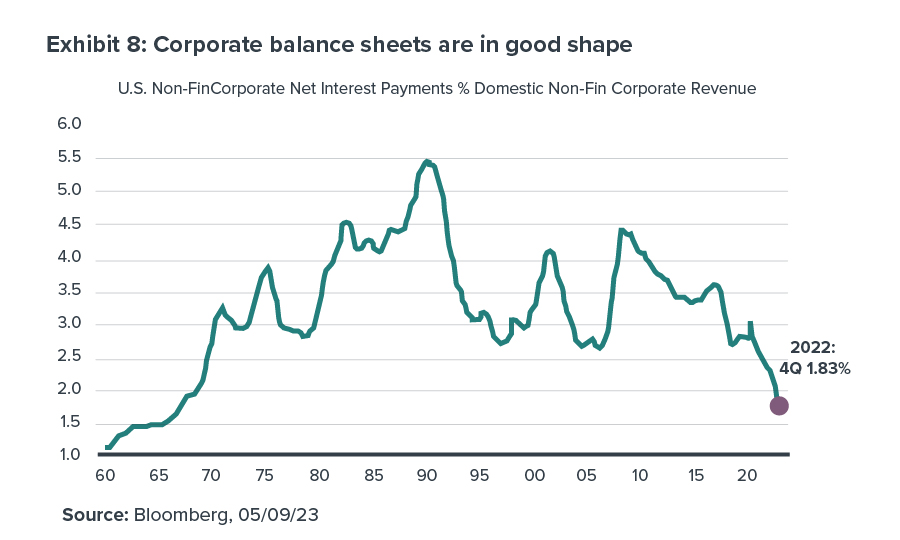
Corporate balance sheets are also strong. Interest payments made by U.S. businesses relative to their revenue currently rest at their lowest levels since the 1960s (see Exhibit 8).
Interest rates may remain “higher for longer.” Several months ago, some investors were predicting that the Fed would begin cutting interest rates by the Fall. But given the resilience of the U.S. economy coupled with slowing (but not yet low) inflation, we believe the Fed is unlikely to start lowering interest rates this year. We anticipate that the Fed will begin to normalize short-term rates during 2024, bringing them closer to 3%. However—barring a recession or other crisis—we expect that normalization to be done at a gradual pace.
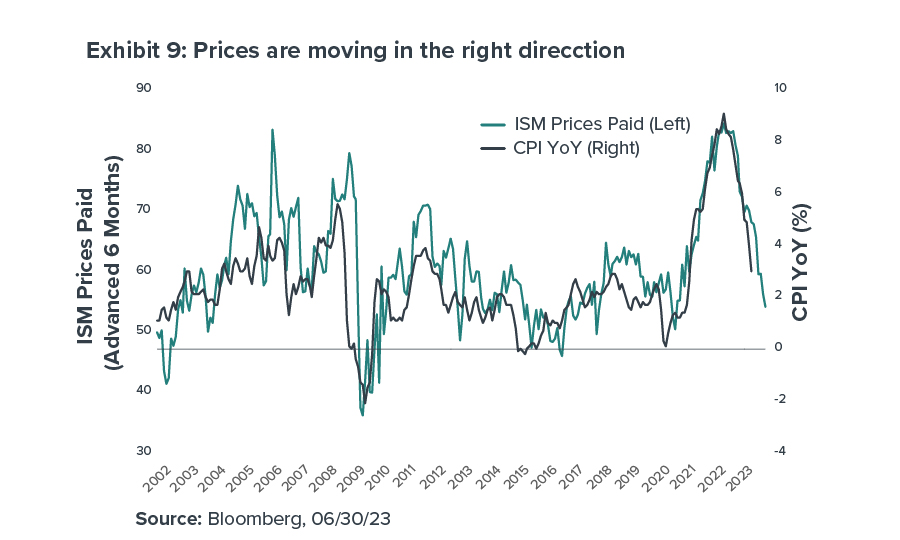
Inflation is on a one-way track lower. The Fed’s series of rate hikes have brought inflation under control and on a clear path toward the Fed’s 2% target. Exhibit 9 shows that the inflation rate tends to track the prices that manufacturers pay for their materials, and that both are moving significantly lower from their recent peaks. The key inflationary issue remaining is wage pressure, which is uncertain and potentially could be the cause of any further Fed rate hikes (should they occur). However, we believe wage inflation issues are likely to be resolved over the next six to 12 months.
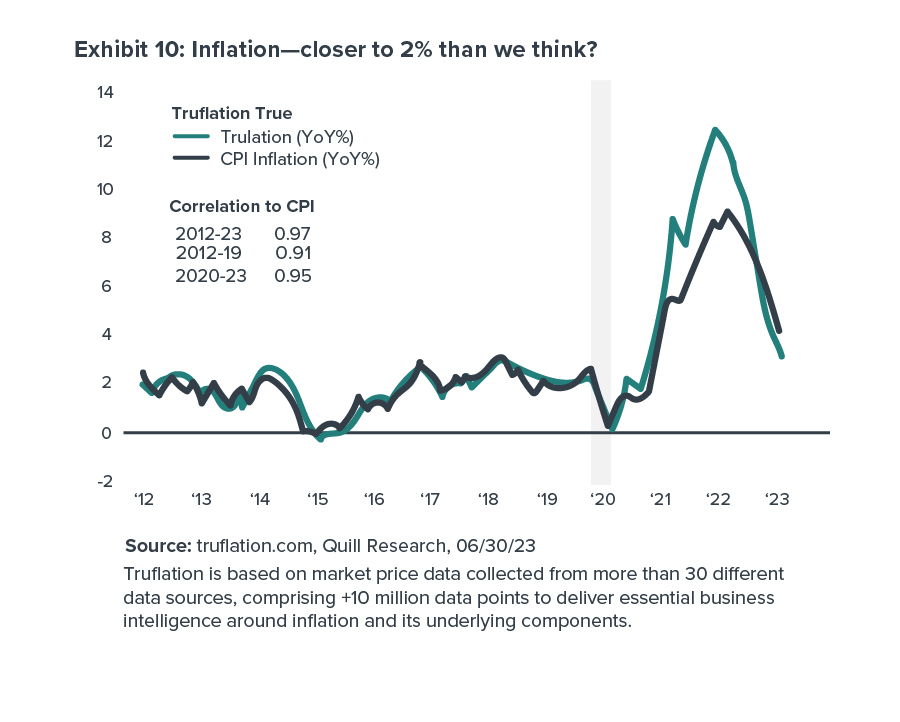
Indeed, by one account, inflation may be closer to the Fed’s 2% target than is commonly recognized. The inflation rate calculated by Truflation3 is currently around 2.2% on a year-over-year basis (as seen in Exhibit 10).
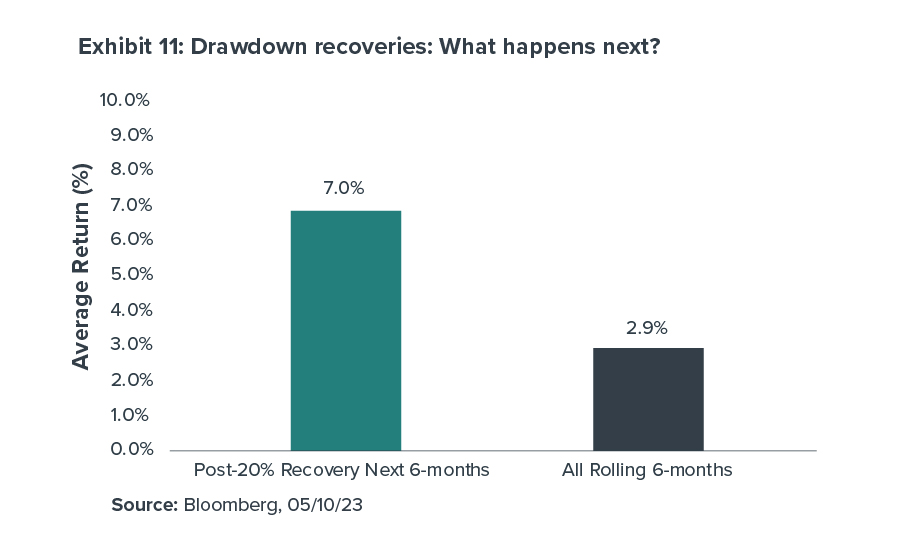
 Equities have history on their side. While there’s no guarantee, history tells us that the current market may have some wind at its back. For example, we identified the specific instances when the S&P 500 rallied by 20% following a drawdown of 20% or more—as it did during the second quarter—going back to 1928. The index’s average return over the next six months was 7% in those cases. That’s significantly higher than the overall average rolling six-month return of just 2.9% (see Exhibit 11).
The stock market rally is broadening out. For much of 2023, the stock market rally was highly concentrated among mega-cap tech shares. Recently, however, more market sectors have joined the party. In June, for example, all 11 of the S&P 500’s industry sectors posted positive returns. This suggests there are many stocks and sectors that may be ready to fully participate in the market’s activity, giving investors multiple areas of potential opportunity if the rally continues to broaden out.