Disclosures
This commentary is written by Horizon Investments’ asset management team.
Past performance is not indicative of future results.
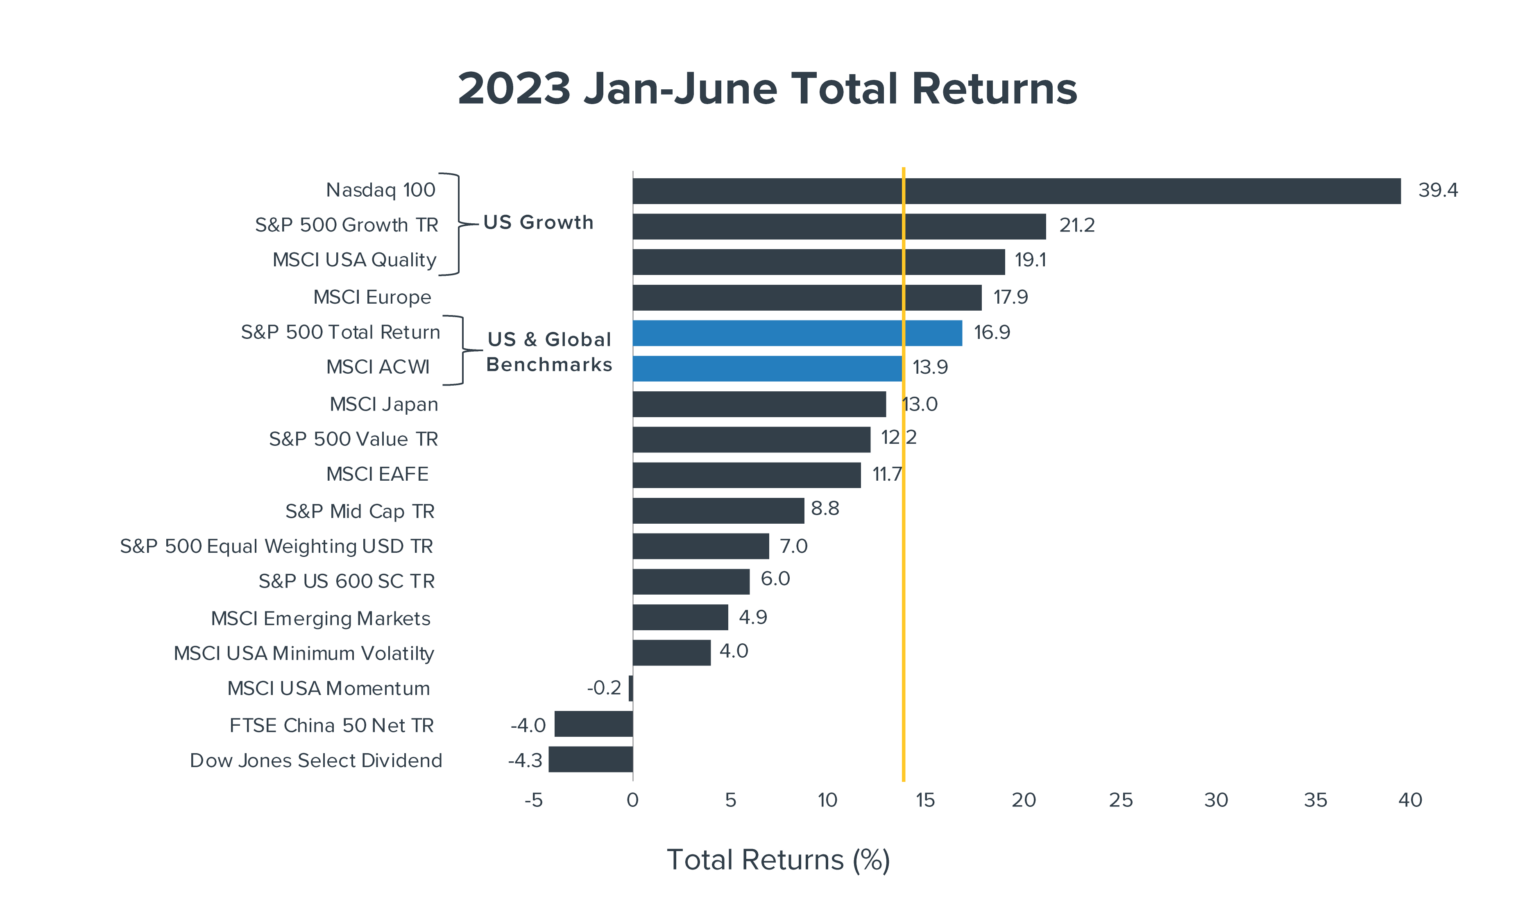
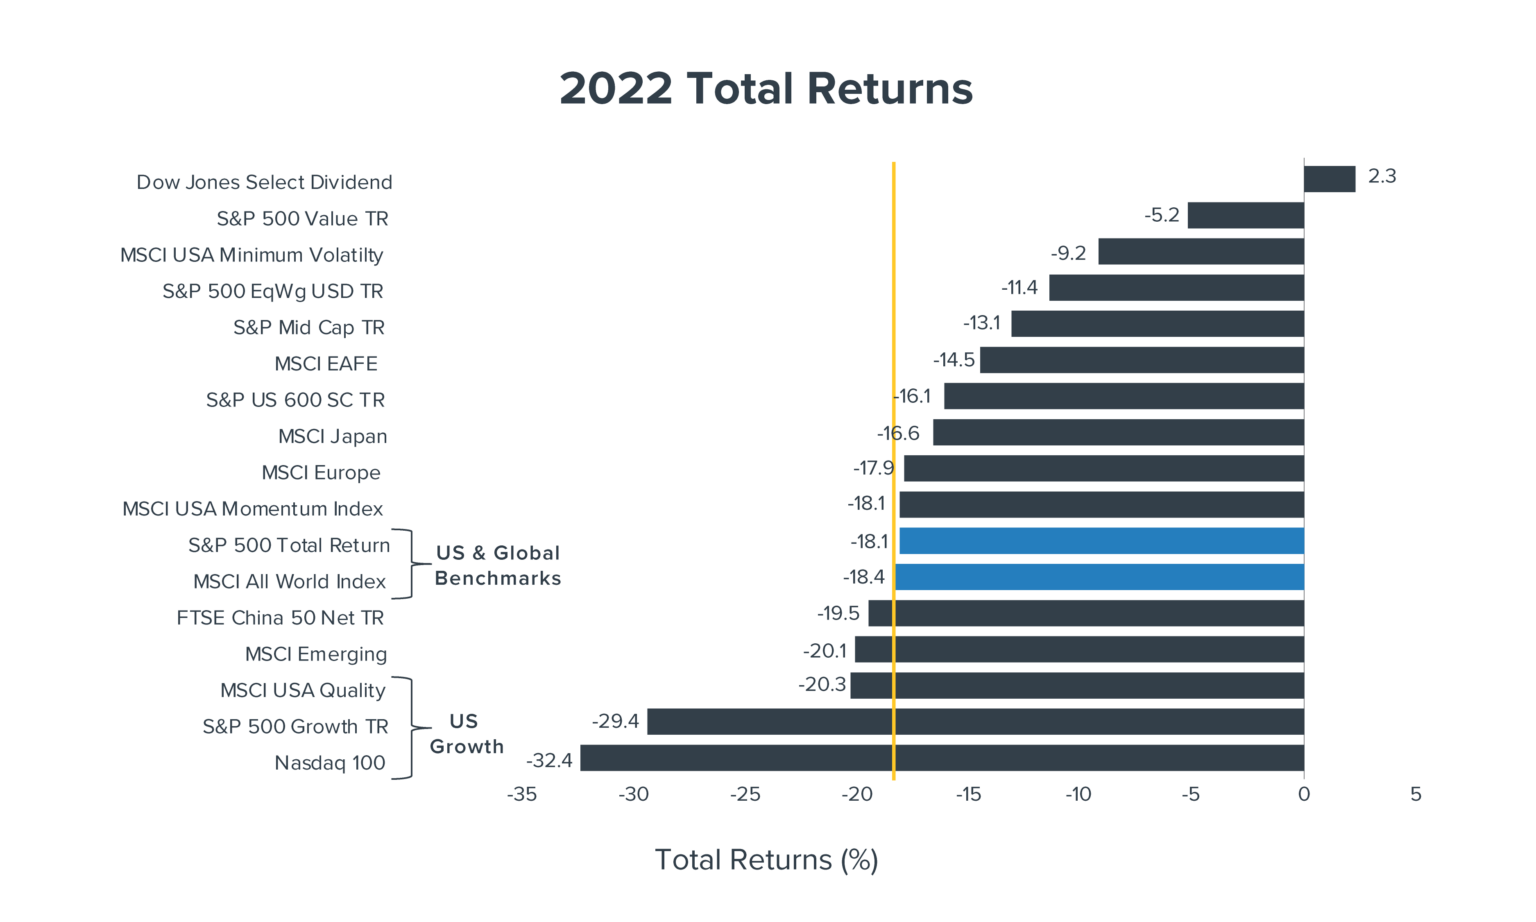
The S&P 500 or Standard & Poor’s 500 Index is a market-capitalization-weighted index of the 500 largest U.S. publicly traded companies. The Dow Jones U.S. Select Dividend Index aims to represent the U.S.’s leading stocks by dividend yield. The S&P 500 Value Index is comprised of the value stocks in the S&P 500 Index. The S&P 500 Growth Index is comprised of the growth stocks in the S&P 500 Index. The MSCI USA Minimum Volatility (USD) Index aims to reflect the performance characteristics of a minimum variance strategy applied to the large and mid-cap USA equity universe. The S&P 500® Equal Weight Index (EWI) is the equal-weight version of the widely-used S&P 500. The S&P MidCap 400 Index serves as a gauge for the U.S. mid-cap equities sector. The S&P Small Cap 600 Index consists of 600 small-cap stocks. A small-cap company is generally defined as a stock with a market capitalization between $300 million and $2 billion. The MSCI EAFE Index is designed to represent the performance of large and mid-cap securities across 21 developed markets, including countries in Europe, Australasia, and the Far East, excluding the U.S. and Canada. The Nasdaq 100 Index is a stock index of the 100 largest companies by modified market capitalization trading on Nasdaq exchanges. The MSCI Japan Index is designed to measure the performance of the large and mid-cap segments of the Japanese market. The MSCI Europe Index is designed to measure the performance of the large and mid-cap segments of the European market. The MSCI USA Momentum Index is based on MSCI USA Index, its parent index, which captures large and mid-cap stocks of the US market. The MSCI ACWI captures large and mid-cap representation across 23 Developed Markets and 24 Emerging Markets countries. The FTSE China 50 Index comprises 50 of the largest and most liquid Chinese stocks (H Shares, Red Chips, and P Chips) listed and trading on the Hong Kong Exchange (HKEx). The MSCI Emerging Markets Index captures large and mid-cap representation across 24 Emerging Markets countries. The MSCI USA Quality Index is based on the MSCI USA Index, which includes large and mid-cap stocks in the US equity market. The index aims to capture the performance of quality growth stocks by identifying stocks with high-quality scores based on three main fundamental variables: high return on equity (ROE), stable year-over-year earnings growth, and low financial leverage. Reference to an index does not imply that any account will achieve returns, volatility, or other results similar to that index. An index’s composition may not reflect how a portfolio is constructed in relation to expected or achieved returns, portfolio guidelines, restrictions, sectors, correlations, concentrations, volatility or tracking error targets, all of which are subject to change. Individuals cannot invest directly in any index. Indices are unmanaged and do not have fees or expense charges, which would lower returns.
Nothing contained herein should be construed as an offer to sell or the solicitation of an offer to buy any security. This report does not attempt to examine all the facts and circumstances that may be relevant to any company, industry, or security mentioned herein. We are not soliciting any action based on this document. It is for the general information of clients of Horizon Investments, LLC (“Horizon”). This document does not constitute a personal recommendation or take into account the particular investment objectives, financial situations, or needs of individual clients. Before acting on any analysis, advice, or recommendation in this document, clients should consider whether the security in question is suitable for their particular circumstances and, if necessary, seek professional advice. Investors may realize losses on any investments.
The investments recommended by Horizon Investments are not guaranteed. There can be economic times when all investments are unfavorable and depreciate in value. Clients may lose money.
Asset allocation cannot eliminate the risk of fluctuating prices and uncertain returns. All investing involves risk of loss, and in periods of market growth, risk mitigation strategies can be expected to lag in performance behind equity strategies that do not focus on risk mitigation.
This commentary is based on public information that we consider reliable, but we do not represent that it is accurate or complete, and it should not be relied on as such. Opinions expressed herein are our opinions as of the date of this document. These opinions may not be reflected in all of our strategies. We do not intend to and will not endeavor to update the information discussed in this document. No part of this document may be (i) copied, photocopied, or duplicated in any form by any means or (ii) redistributed without Horizon’s prior written consent. Forward-looking statements cannot be guaranteed.
Other disclosure information is available at hinubrand.wpengine.com.
Horizon Investments and the Horizon H are registered trademarks of Horizon Investments, LLC
©2023 Horizon Investments LLC