

The idea that the financial markets “climb a wall of worry” by showing resilience in the face of significant challenges was fully displayed during the first quarter of 2023.
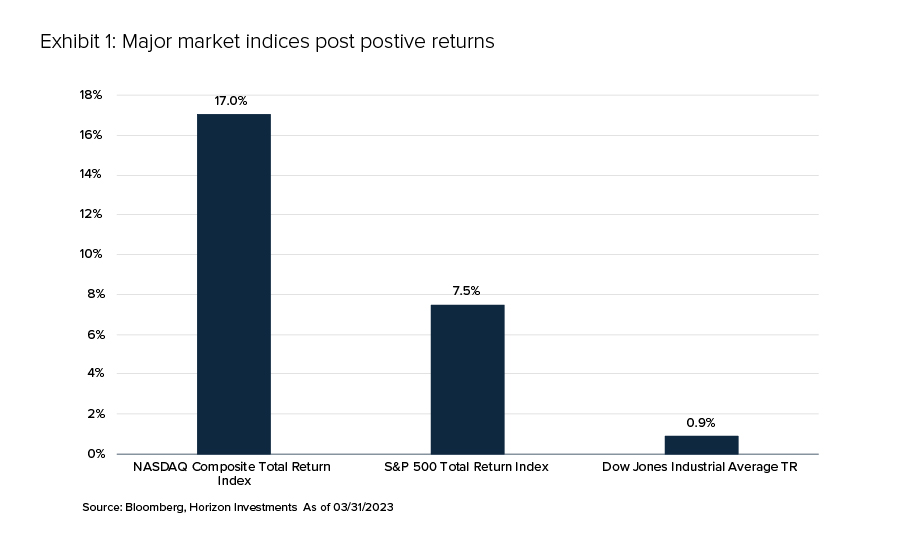
Despite tremendous uncertainty about economic growth, inflation, and even the structural health of the financial system itself, major U.S. equity market indices ultimately gained ground during the three months that ended March 31, 2023 (see Exhibit 1). In particular, the S&P 500 Index recorded its second consecutive quarterly gain, while the Nasdaq posted its best quarterly return since 2020.
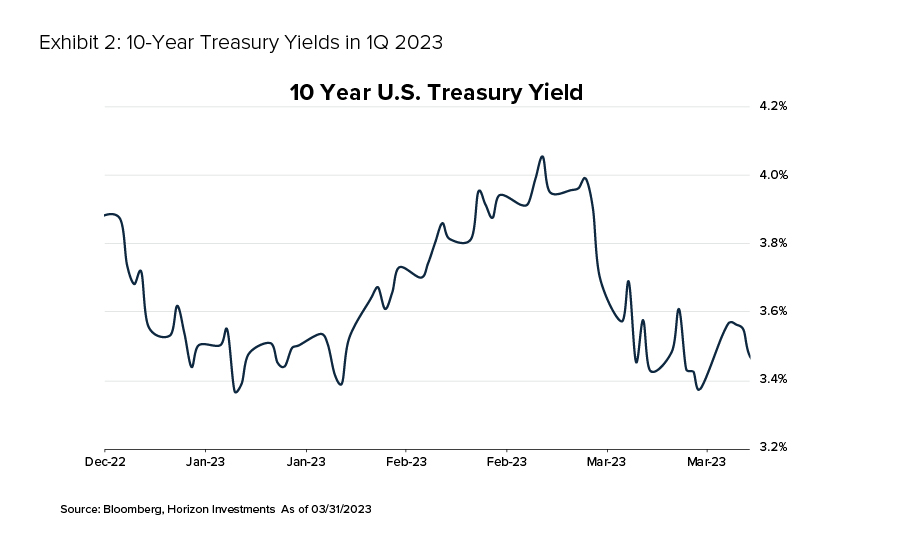
The bond market also saw strong (albeit extremely volatile) performance, with the Bloomberg U.S. Aggregate Bond Index gaining 3.0% as bond yields (which move inversely to bond prices) fell. For example, the 10-year U.S. Treasury yield started 2023 at 3.88% before rising to a high of 4.05% and ended the quarter at 3.47% after dipping as low as 3.37% (see Exhibit 2).
The path to those returns could have been smoother. Markets rallied to start the year as signs of moderating inflation, wage growth, and soft retail sales made investors optimistic that the Federal Reserve Board (Fed) might soon ease up on the interest rate hikes it began in 2022 to combat runaway inflation.
Such optimism faded throughout February, and markets reversed course as stronger-than-expected growth in employment, inflation, and retail sales revealed a “still too hot” economy that would likely keep the Fed on its restrictive monetary policy path. Fed Chair Powell in early March stated that interest rates would rise further, possibly faster than expected.
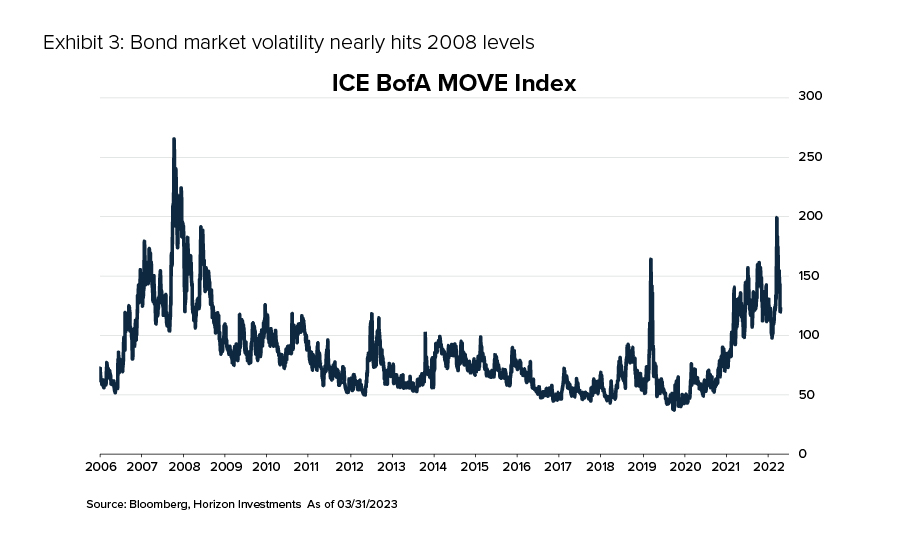
Shortly after that, however, markets experienced turmoil as two large U.S. banks—Silicon Valley Bank and Signature Bank—failed, followed by fears that Swiss megabank Credit Suisse could be next. Investors worried that these developments could cause a global banking crisis and recession. One result: The ICE BofAML MOVE Index, which measures implied volatility in the U.S. Treasury market, soared to its highest since the global financial crisis of 2008 (see Exhibit 3).
The Fed and regulators acted swiftly to contain the damage. By the end of the quarter—in yet another about-face—some investors predicted that Fed policy would soon shift from raising interest rates to cutting them to bolster the economy.
There’s no question that many economic and market conditions are highly fluid and evolving as we begin the second quarter. However, several key focal points, viewed together, give us a good picture of where we stand today—the foundation from which future outcomes could develop. For example:
Financial market stability
Banking woes during the first quarter were a nerve-wracking reminder for many investors of the 2008 financial crisis that took down financial industry giants such as Bear Stearns and Lehman Brothers, threatened the entire global financial system, and helped spark a deep recession.
Fortunately, a repeat of the 2008 crisis is unlikely. Consider some key differences:
- Today’s problems have concentrated mainly among relatively small regional banks instead of the largest, most interconnected global financial institutions.
- The recent pain has primarily been related to these banks’ questionable decisions involving U.S. Treasury bonds versus the complex and highly risky financial products that underpinned the issues in 2008.
- The Federal Reserve Board responded to today’s bank issues extremely rapidly and decisively, helping shore up the sector’s health and investor sentiment about the industry.
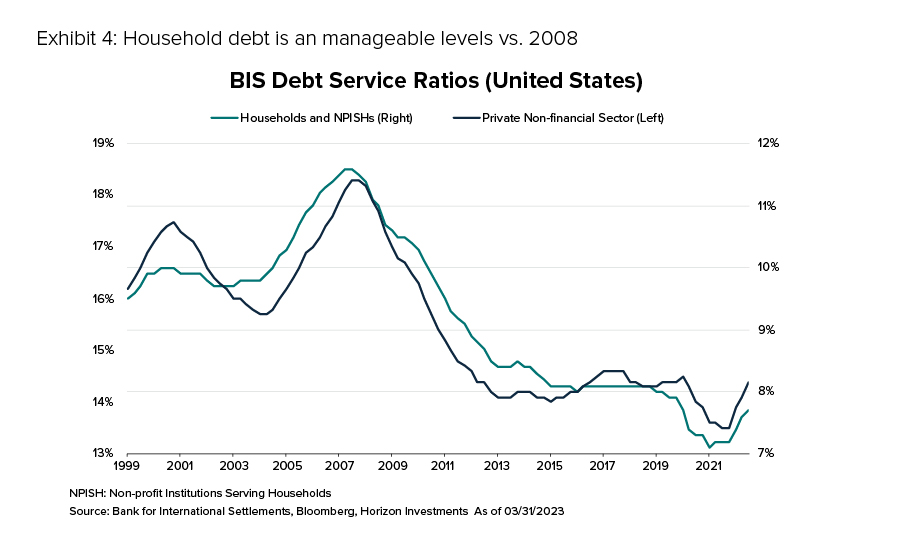
Another key factor: Today, businesses and consumers are in much better overall financial shape than in 2008. Exhibit 4 shows the relatively low household debt levels today compared to 2008 and highlights the low private debt service ratio for non-financial U.S. businesses.
Inflation
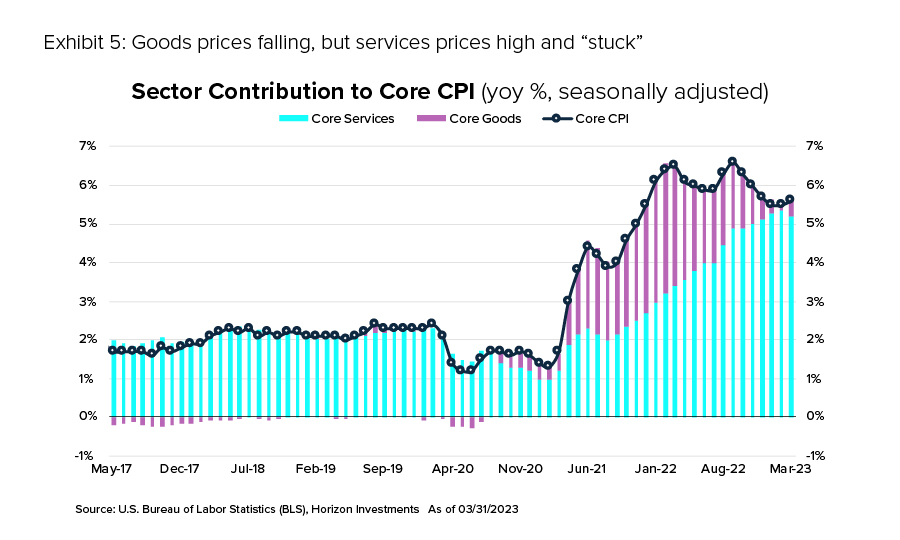
In many ways, inflation has continued to progress toward the Fed’s goal of 2%. For example, the prices of core goods have fallen steadily for some time, as seen in Exhibit 5. Housing and shelter inflation has also moderated. However, as Exhibit 5 also shows, core service prices remain stubbornly high. Since services represent most of the inflation measurements, overall inflation remains significantly higher than the Fed’s target.
Employment/the labor market
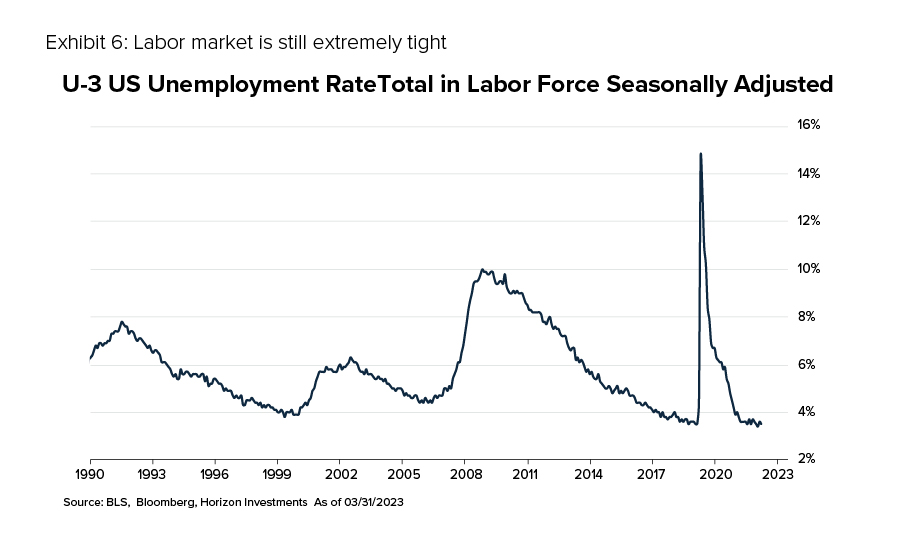
The tight labor market is a key driver of that “sticky” inflation in the services sector. Service-based companies continue to struggle to find workers, while the pressure to offer higher wages to attract those workers remains high, as reflected by the extremely low unemployment rate shown in Exhibit 6.
Interest rates/the Fed.
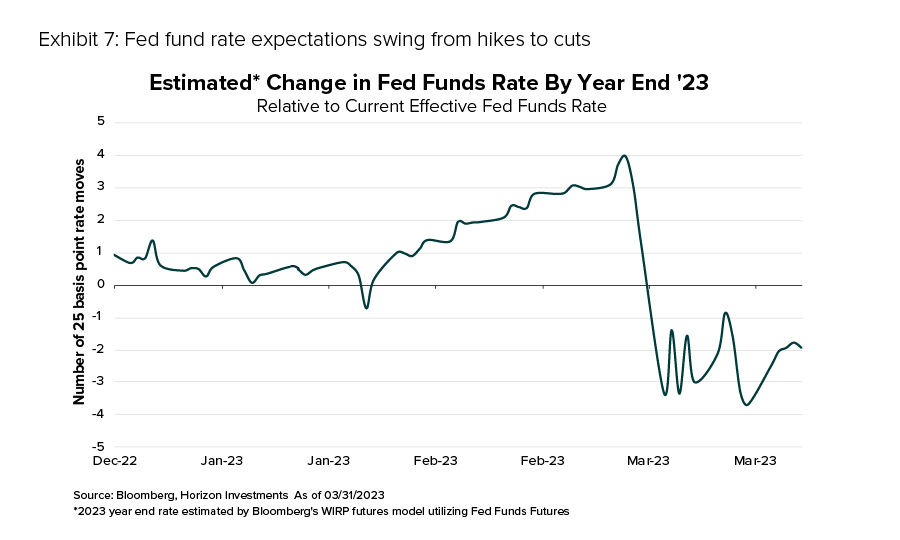
Predictions about what the Fed would do next see-sawed dramatically during the quarter in response to the banking sector’s woes and the potential economic impact. In just one week, for example, the market went from predicting four additional interest rate (fed funds rate) hikes to fight rampant inflation to pricing in four rate cuts by the end of 2023 to boost economic growth (see Exhibit 7).
However, market expectations for inflation over the longer term remain well anchored at around 2%. That indicates investors and consumers are confident that the Fed will steer inflation back to its desired target rate over time.
At its latest meeting in March, the Fed raised the Fed funds rate by 25 basis points—less than the 50-basis point hike expected prior to the banking troubles—and suggested that the rate hikes could slow or even stop at some point this year. How that plays out will depend on the data that comes out during the rest of the year. However, given that the Fed has already raised rates nine times this cycle, one or two more increases may have a smaller impact on markets than they did when uncertainty was higher in 2022.
Volatility
The recent volatility noted above, particularly in the bond market, remained in place as the quarter ended. One stark example: The market is expecting the yield on the two-year Treasury note—which might move up or down by a mere two basis points in a typical trading day—to fluctuate by 11 basis points per day in the coming months.
These conditions serve as the foundation—the jumping-off point—for the second quarter and beyond. But given the rapidly evolving nature of so many key factors, the obvious question is: In what direction do we go from here?
Our analysis points to three potential scenarios that may unfold going forward.
Scenario One: Things get better
One outcome is that economic conditions improve significantly, setting the stage for continued economic momentum coupled with lower inflation and shifting to a neutral or accommodative Fed policy. Likely developments we would see include:
Banks stabilize. In this scenario, additional signs that the impact of recent regional bank failures hasn’t spread beyond the banks affected in the first quarter would alleviate concerns about the financial system’s health. Depositors would regain confidence that their savings/deposits are secure and banks’ willingness to lend money could expand back to pre-bank failure levels.
Inflation continues to moderate. As the quarter ended, the Fed’s preferred gauge of inflation—the core PCE index—showed inflation rising by 0.3% in February. That was a smaller increase than expected and lower than the 0.5% increase in January. In an improving environment, goods inflation would continue to decline. In contrast, services inflation becomes “unstuck” and begins to fall steadily–likely prompting the Fed to cut rates.
Consumer confidence gains momentum. Even in the face of bank failures and continued high inflation, consumers show resilience—with reasonably strong confidence levels and opinions about their financial situations. If inflation moderates and the uncertainty around banks dissipates, we expect those readings to improve even further.
Stocks and bonds benefit. Equities perform well, led by financials and cyclical stocks that have traditionally benefited from a strong economy. Defensive stocks struggle as the economy remains healthy. The U.S. dollar falls, giving a boost to international stock returns. The yield curve steepens, and corporate bonds benefit.
Scenario Two: Things get worse
An alternative scenario involves deep and ongoing banking issues that spread well beyond just the few institutions impacted thus far and a slow or ineffective policy response to that worsening crisis. In that environment, key developments we would likely see include:
Access to credit dries up. Noted above, as a result of the failures of SVB and Signature, banks became less willing to make loans during the first quarter. A deeper banking crisis would greatly slow or even stop the flow of loans—drastically reducing consumers’ and businesses’ ability to spend, expand and grow.
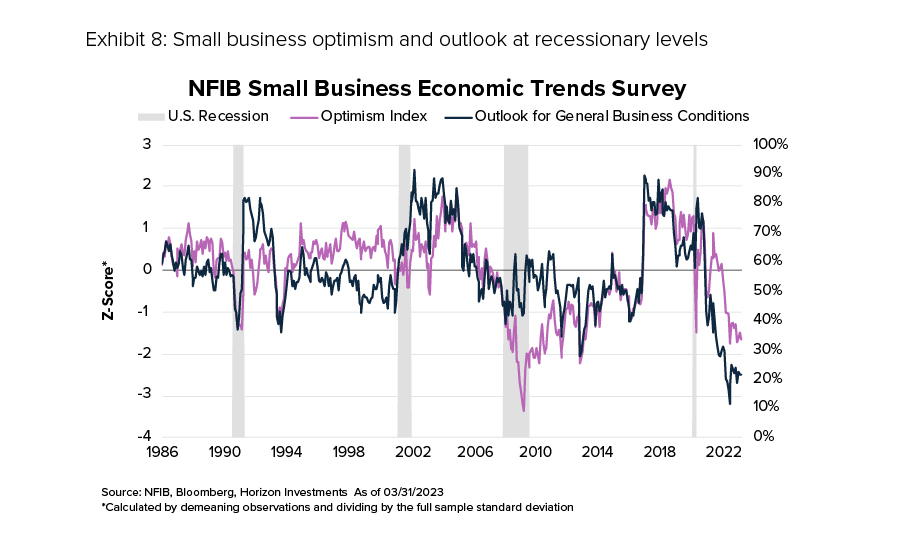
Unemployment rises sharply. Significantly lower demand would spur layoffs that cause unemployment to spike. Currently, small businesses’ optimism and outlook for the future are at levels often seen during recessions (see Exhibit 8). Given that, even a small decline in demand could cause pessimistic businesses to pull back.
Economic growth contracts. Historically, when bank loan activity falls, economic growth follows suit. And typically, the sharper the decline in loans, the more significant the decline in GDP growth.
Investors flock to quality. Investors would favor assets perceived as having the highest quality prospects in a struggling economy—such as long-term Treasury bonds, large-caps (mega-cap tech, in particular), and defensive sectors that can better withstand an economic downturn. Equities would suffer, with financials, small-cap stocks, and cyclical sectors likely seeing the worst damage in the weak environment. International markets would lag the U.S. as foreign investors would flock to the perceived safety of U.S. assets.
Scenario Three: Things stay mostly the same
A slowdown in credit creation would characterize a third potential path due to lingering concerns about the bankingsystem, but one that stops well short of becoming a serious, systemic problem. Hallmarks of this essentially “middle-ground” scenario between the two other outcomes would likely include:
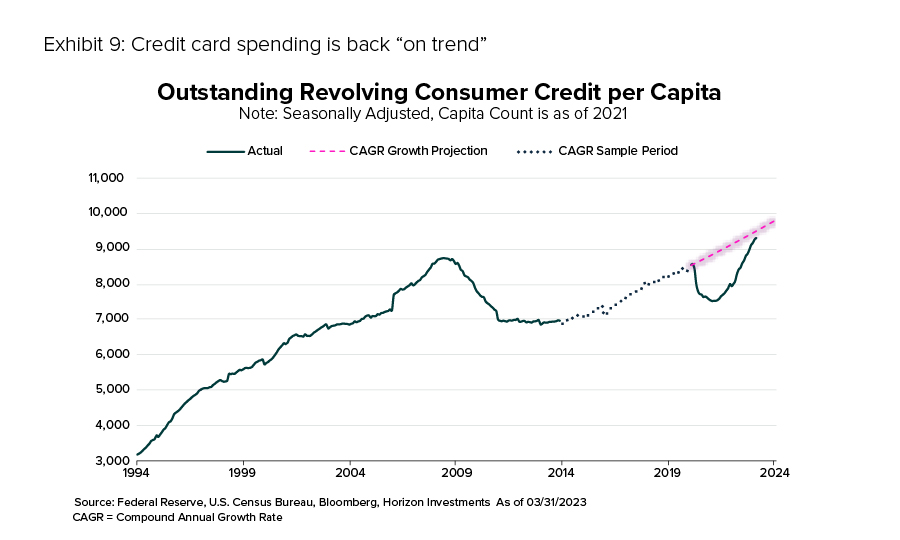
Reasonable consumer confidence. Consumer confidence would hover roughly around its recent levels, as no data or developments would be conclusive enough to increase or decrease overall confidence greatly. As a result, consumer spending and household finances would remain on their current healthy track. Consider, for example, that despite numerous media reports about the sharp rise of credit card debt, card balances per capita have essentially reverted to their pre-pandemic trajectory rather than risen to an alarming level (see Exhibit 9). As a result, consumer spending and household finances would remain on their current healthy track.
Additionally, compensation has remained relatively strong and above trend. Therefore, the need for U.S. workers to borrow is lower than normal, making a slowdown in bank lending activity less of a drag on consumers.
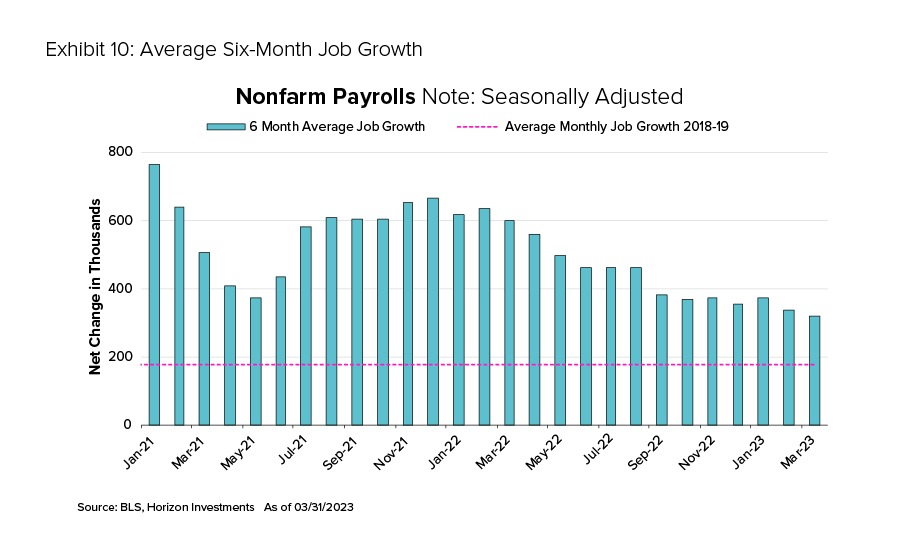
Slower–but positive–job growth. Small business owners may appear pessimistic, as noted earlier, but their actions support an outlook of continued job growth. For example, small businesses are still hiring and are not planning on raising prices from current levels—both of which suggest conditions where the job market remains healthy while inflation dissipates. As seen in Exhibit 10, average six-month job growth has remained above trend and shows more of a leveling off in recent months than a dramatic reduction.
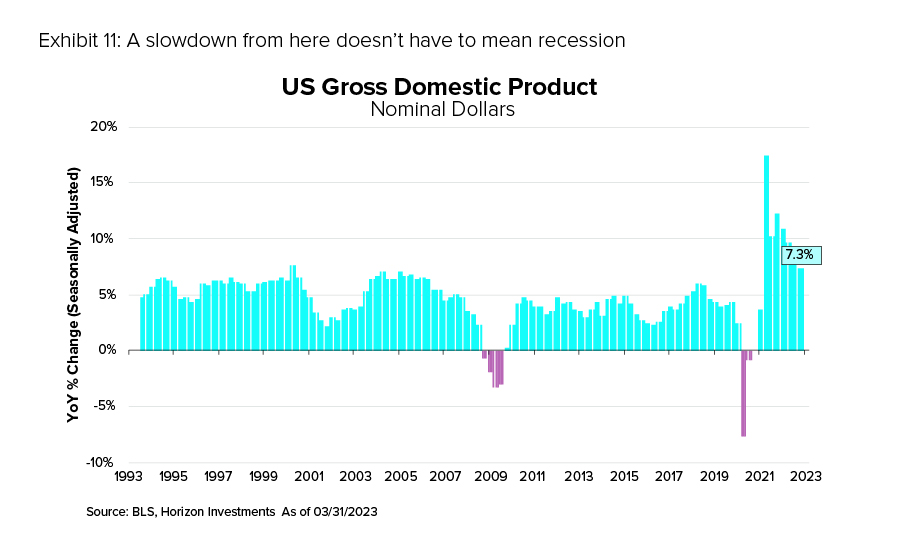
Slower—but positive—economic growth. Less lending and credit creation would likely slow the economy. But the momentum from consumers could delay or even prevent a recession, particularly given the relatively strong economy now. As Exhibit 11 shows, nominal GDP growth in recent quarters has been historically robust (even as it has slowed.) A further slowdown from these current levels would not mean a recession is imminent or even assured. Rather, in an environment in which other factors stay reasonably healthy, the economy would be more likely to generate positive nominal growth.
Notably, the market appears to agree with this premise as we start the second quarter. Typically, bond investors predicting a recession might expect the Fed to cut interest rates by 300 to 400 basis points. Today, however, the market is looking for rates to be cut far less—by only around 200 basis points. We believe that outlook reflects a soft-landing scenario much more than it does a recessionary outcome.
A choppy market
Stocks will likely trade in a range if the future is essentially “more of the same,” without making new highs or new lows—and frustrating both bulls and bears as a result. Tech stocks and shares of higher-quality companies would likely lead, thanks to their access to capital markets and generally healthy balance sheets, while financial stocks and small-company shares (and other cyclical sectors) would remain under pressure. The dollar would also likely be range bound. Internationally, China would present opportunities from the reopening of its economy as its own domestic story plays out and becomes a driver of equity market returns.