




FOCUS Quarterly Report | Q3 2026

Earnings at the Wheel: Profits Power Markets as AI Rolls On


Overview

The third quarter of 2026 brought meaningful reversals in market leadership despite continued strength in the economy and corporate earnings. Interest rates rose to cycle highs, while some of the year’s strongest AI-related winners reversed course even as underlying demand remained strong. Yet equities still managed modest gains, supported at least in part by robust earnings growth.

We see these shifts as reflecting a changing market rather than a weakening one. Higher rates increasingly reflect economic strength and a more normal bond market, while volatility within the AI trade points to a theme that continues to mature and broaden. Beneath an otherwise calm market, leadership is changing, and we believe that creates opportunity for investors willing to be selective.


High Interest Rates Do Not Have to Break the Market

Through the third quarter, the U.S. 10-year yield has risen nearly 100 basis points in 2026, while market expectations for Fed policy have shifted from two cuts to three hikes. Brent crude remains near $100 a barrel, and the dollar is nearly 4% stronger – yet equities seemingly remain resilient. Inflation is not the primary driver: 10-year breakevens are up just 10 basis points, leaving real yields to explain most of the move. Strong growth, corporate earnings, and competition for capital all support higher rates, making the move appear warranted in our view.

Rates have returned to more historically normal levels and, in our view, increasingly reflect strong growth rather than restrictive conditions, a view also expressed by Fed Chair Warsh. Table 1 shows that the 1990s saw an average 10-year yield of 6.6%, yet both stocks and bonds generated strong real returns. While rates can only rise so far before restricting growth, we don’t appear to be there yet. In what we might call a more normal bond market, bonds tend to deliver attractive yields if growth stays strong and have room to rally if growth weakens. Ultimately, we believe a healthy bond market can provide a supportive backdrop for risk assets, allowing both stocks and bonds to perform well so long as growth remains stable.

Table 1: Real Returns by Decade vs. U.S. 10-Year Yield
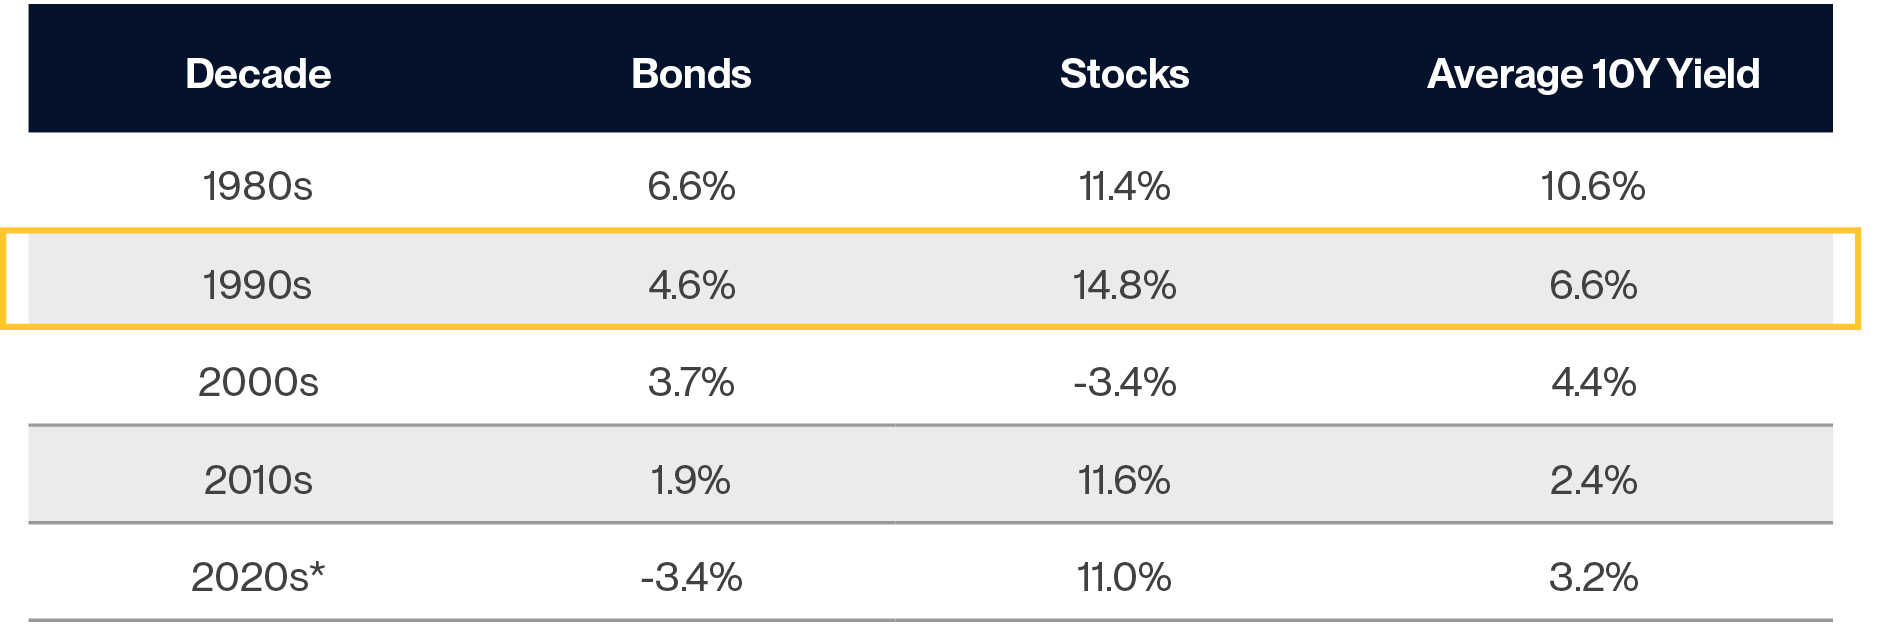
* 2020s partial (12/31/2019 – latest). Real return = (1 + nominal CAGR) / (1 + avg CPI YoY) − 1. Stock returns are price-only.
Bonds are represented by the Bloomberg U.S. Aggregate Bond Index.
Stocks are represented by the S&P 500 Index. Inflation is represented by the Consumer Price Index, year over year.
See disclosures for index definitions. Bloomberg, calculations by Horizon, data as of 09/30/2026. 

Earnings Remain in the Driver’s Seat

Perhaps surprisingly, forward valuations are recently down across most major equity market segments. As Chart 1 shows, earnings growth has generally driven year-to-date (YTD) returns across regions and styles, while falling valuations have detracted. Companies have consistently outperformed analysts’ expectations by large margins this year as things such as AI demand, healthy consumers, and a stable labor market have supported an inflection higher in top-line growth and margins across the economy.

Chart 1: YTD Total Return Decomposition Across Major Market Segments
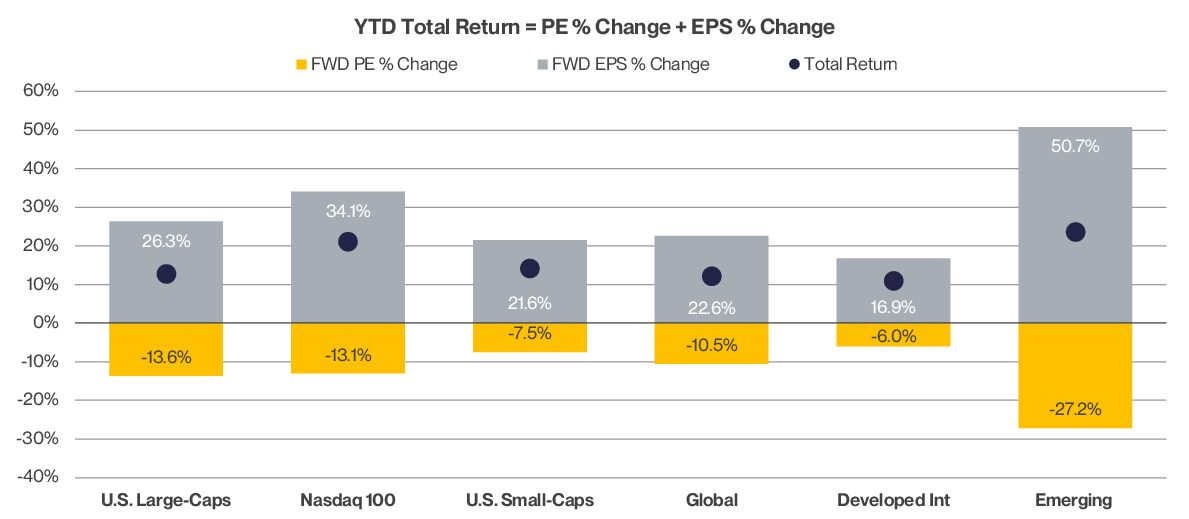
U.S. Large Caps are represented by the S&P 500. U.S. Small Caps are represented by the S&P 600. Global is represented by the MSCI World Index. International Developed Markets (DM) are represented by the MSCI EAFE Index. Emerging Markets (EM) are represented by the MSCI Emerging Markets Index.
See disclosures for index definitions. Bloomberg, calculations by Horizon, data as of 09/30/2026.

Equities can be supported by earnings growth, the price investors are willing to pay for those earnings, or accommodative financial conditions. While these forces are interconnected, earnings have done most of the heavy lifting this year. With rates much higher and broader financial conditions tightening recently, equity valuations have been under pressure, narrowing the margin for error on earnings if this support for equities were to continue.


The Next AI Trade Continues to Mature

The first phase of the AI trade was about who was spending the money (Magnificent 7). The second was about who was receiving it (semiconductors). We believe the next phase is about who can actually use it, with software providing an early example. But the opportunity is broader: the question now is which companies across the market can turn AI into productivity, margin expansion, and earnings growth.

As we highlighted last quarter, AI has created a wide performance gap among the spenders, receivers, and first-line users. While this group has been highly volatile, third-quarter price action suggests the market may be looking toward the software phase. Chart 2 shows software up 27% in this quarter while semiconductors fell 7%. Importantly, this happened despite continued strong AI infrastructure demand and solid earnings – reinforcing that expectations, not just fundamentals, matter for market leadership.

While AI was seen as a disruption risk in software earlier in the year, these lowered expectations created an opportunity in the third quarter. Looking ahead, software may continue to benefit, but we expect the opportunity to broaden. Federal Reserve research identifies Information, Finance, and Professional and Business Services as among the industries with the greatest AI exposure, suggesting AI’s productivity benefits could increasingly extend beyond the companies building the infrastructure.

Chart 2: AI Leadership Shifted in the Third Quarter
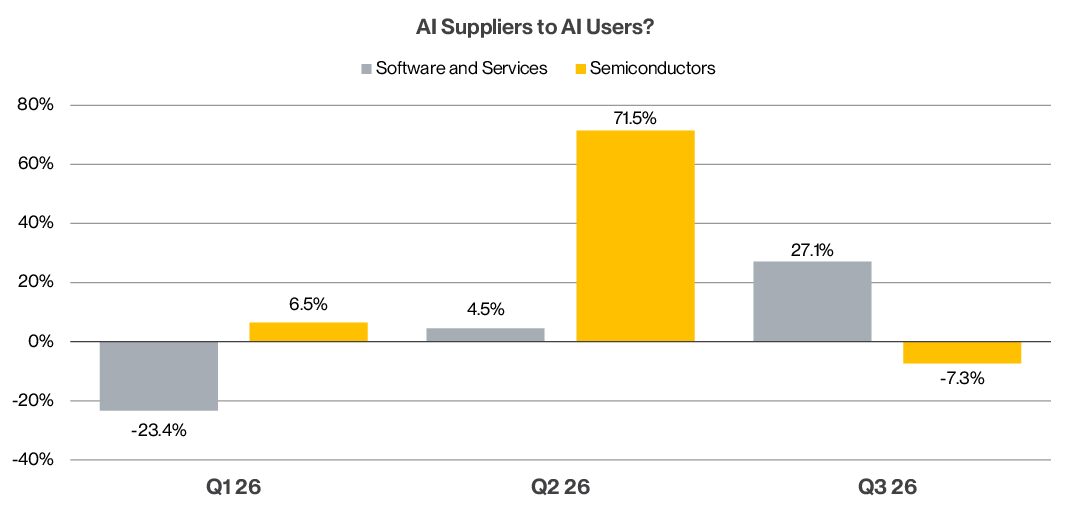
Software & Services measured by the Software & Services Industry Group Index. Semiconductors measured by the MVIS US Listed Semiconductor Index.
See disclosures for index definitions. Bloomberg, calculations by Horizon, data as of 09/30/2026.

Key Takeaways

In our view, the economy is booming, consumers remain strong, corporate earnings are growing, and productivity is improving. Despite higher rates and shifting market leadership, we continue to see a constructive backdrop for investors:

  • Higher rates, strong foundation: Interest rates have risen sharply, but we believe that increasingly reflects economic strength and a more normal bond market rather than restrictive conditions. Fixed income also looks more attractive than it has in years, potentially supporting risk assets and more resilient portfolio construction.
  • Earnings remain in the driver’s seat: Earnings growth has driven equity gains this year even as valuations have declined. That leaves less margin for error if profits weaken, but for now, we believe corporate earnings remain on a strong trajectory.
  • Rotation, not retreat: Higher rates are affecting industries unevenly, and leadership within the AI trade continues to evolve. But the volatility beneath the surface has largely reflected rotation within equities rather than a retreat from them, creating what we see as opportunities for selectivity as market leadership shifts.

As we approach the midterm elections in the fourth quarter, history reminds us, as discussed in more detail in our midterm elections piece, that political outcomes have not reliably guided long-term investment performance. Risks remain, but we remain optimistic about the strength of the American economy and the opportunities being created as market leadership evolves. 

Past performance is not indicative of future results. The commentary in this report is not a complete analysis of every material fact with respect to any company, industry, or security. The opinions expressed here are not investment recommendations but rather opinions that reflect the judgment of Horizon as of the date of the report and are subject to change without notice. Opinions referenced are as of the date of publication and may not necessarily come to pass. Forward-looking statements cannot be guaranteed.
We do not intend and will not endeavor to provide notice if and when our opinions or actions change. Horizon is not soliciting any action based on this document. This document does not constitute an offer to sell or a solicitation of an offer to buy any security or product and may not be relied upon in connection with the purchase or sale of any security or device. The investments recommended by Horizon are not guaranteed. There can be economic times when all investments are unfavorable and depreciate in value. Clients may lose money.
The MSCI World Index measures the performance of large- and mid-cap stocks across 23 developed markets worldwide, providing broad exposure to developed-market equities. The MSCI EAFE Index tracks large- and mid-cap companies in developed markets outside the U.S. and Canada, including Europe, Australasia, and the Far East. The S&P SmallCap 600 Index (S&P 600) measures the performance of 600 small-cap U.S. companies and is designed to represent the domestic small-cap equity market. The MSCI World Index since 1995 refers to the historical performance of the MSCI World Index beginning in 1995, illustrating long-term returns for developed-market equities. The S&P 500 Index tracks 500 leading large-cap U.S. companies and is widely regarded as the primary benchmark for the U.S. stock market. The Nasdaq-100 Index measures the performance of 100 of the largest non-financial companies listed on the Nasdaq Stock Market, with significant exposure to technology and growth-oriented sectors. The MSCI Emerging Markets (MSCI EM) Index measures the performance of large- and mid-cap companies across 24 emerging market countries, providing broad exposure to developing economies around the world. References to indices or other measures of relative market performance over a specified period of time are provided for informational purposes only. Reference to an index does not imply that any account will achieve returns, volatility, or other results similar to that index. The composition of an index may not reflect the manner in which a portfolio is constructed in relation to expected or achieved returns, portfolio guidelines, restrictions, sectors, correlations, concentrations, volatility or tracking error targets, all of which are subject to change.
Information has been obtained from sources considered to be reliable, but accuracy and completeness cannot be guaranteed.
Horizon is an investment advisor registered with the U.S. Securities and Exchange Commission. Registration does not imply a certain level of skill or training. More information about Horizon’s investment advisory services can be found in our Form ADV Part 2, which is available upon request.
Horizon Investments is a registered trademarks of Horizon Investments, LLC.
© 2026 Horizon Investments, LLC.
NOT A DEPOSIT | NOT FDIC INSURED | MAY LOSE VALUE | NOT BANK GUARANTEED | NOT INSURED BY ANY FEDERAL GOVERNMENT AGENCY

Follow us on:

You are now leaving this website to go to HorizonMutualFunds.com