




FOCUS Quarterly Report | Q2 2026

Breaking the Market Playbook


Overview

The first half of 2026 illustrated that markets often lead, and sometimes defy, conventional wisdom. War broke out in the Middle East, inflation expectations fell and markets looked through the near-term noise, much as they did with tariffs last year. Equity prices hit records, and valuation multiples declined. AI pushed further into the workforce, and jobs data show no sign of the disruption everyone predicted. Even the Fed’s first new Chair since 2018 couldn’t unsettle investors, as long-end yields fell on the committee’s firm commitment to price stability.

We’ll explore these themes in more detail below.


Inflation: Here Today and Gone Tomorrow?

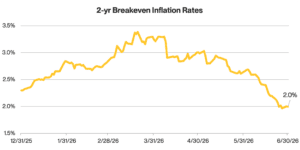
As we highlighted last quarter, the oil price and supply shock impacts from the War in Iran should range from minimal to moderate if the time under conflict is brief – and that is exactly what we got. While passage through the Strait of Hormuz has not fully normalized, the disruption is manageable. Both sides have made progress towards a resolution, giving markets the green light to look beyond negative headlines. Chart 1 shows this through breakeven inflation rates implied by the Treasury Inflation-Protected Security (TIPS) market, where two-year breakeven rates now sit at 2% from a peak of nearly 3.4%, and are surprisingly lower than where we started the year.

Chart 1: Expected Inflation Has Abated
 
Bloomberg, calculations by Horizon, data as of 06/30/2026

We can’t talk about inflation without commenting on the Fed. What we’ve heard from Kevin Warsh, the new Fed Chair, is a commitment to price stability. He promised “fresh thinking” and a “new chapter” as he rolled out plans for task forces in five key areas. In our view, as long as incoming inflation data remains tame, this may allow for a wait-and-see approach from the Warsh Fed in the months ahead.


AI Disruption: Broadening Among Stocks? Narrowing Among Themes

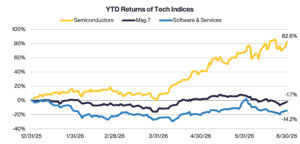
A broadening among stocks in recent years has generally been associated with underperformance among the Magnificent 7 and the largest-cap companies. The second quarter, however, told a different story. Rather than broadening, market leadership narrowed around AI infrastructure, driving significant disruption within the Technology sector. For the first time in many years, we’ve seen persistent weakness among the Magnificent 7. Not because leadership broadened, but because it shifted to a different, still narrow, group of AI beneficiaries. Chart 2 illustrates this rotation following the semiconductor sector’s best quarter on record. As a group, the Magnificent 7 posted a small loss through the second quarter, while the software space has only barely recovered from a disastrous first quarter amid fears AI could make most of the sector obsolete.

Chart 2: Disruption Among Technology Segments
Bloomberg, calculations by Horizon, data as of 06/30/2026

While it seems unlikely that AI disruption will affect every software company equally or that the Mag 7 will squander their investment in uneconomic projects, market crowding in the tech sector has been extreme this year. That opens up potential opportunities and leaves us asking which sectors of the economy may be next. Finding those industries as AI matures beyond infrastructure and begins to drive broad revenue growth and productivity gains is a focus of ours in the months ahead.


It’s Not Valuations: Earnings Are Driving Markets

Despite concerns that AI has inflated a market bubble, we believe the opposite has actually happened. Stock prices have risen, but earnings have risen even faster, leaving valuations down nearly 10% for the year in large-cap U.S. stocks. Markets aren’t getting more expensive. They’re getting more profitable.

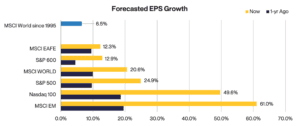
Chart 3 shows earnings growth clearly across major global market segments. Looking back over the past 30 years, global stock earnings growth averaged about 6.5%. Today, however, we see global earnings growth at over 20%, with an inflection higher across all major markets from already-elevated levels one year ago.

Chart 3: Earnings Growth Has Exploded
Bloomberg, calculations by Horizon, data as of 06/30/2026

This profit boom is yet another sign of the market impact of strong economic tailwinds. AI-powered productivity gains and healthy consumer spending (supported by robust personal and household finances) continue despite geopolitical concerns and higher interest rates. Importantly, these productivity gains have not come at the expense of the labor market. Employment has remained resilient, fueling debate over whether AI is boosting workers’ capacity rather than replacing them.


Key Takeaways

As we look to the second half of the year, we think focus will shift from navigating geopolitical uncertainty to evaluating how policy, innovation, and capital markets evolve around these broad themes:

  • Inflation risk has receded, but will it last? We believe so and will look to a committed Fed under new leadership to follow through and allow markets to focus more on economic fundamentals.
  • AI has entered a new phase of leadership and has finally broadened beyond the hyperscalers. Looking ahead, the next stage of AI may shift from building infrastructure to generating measurable productivity gains and earnings growth across a much wider range of industries.
  • Earnings are in the driver’s seat. Identifying the market segments poised for accelerated operating leverage from AI-driven productivity gains is likely the next wave of disruption.

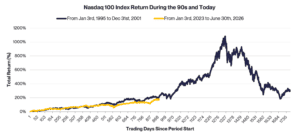
Chart 4: The 90s vs. Today
Bloomberg, calculations by Horizon, data as of 06/30/2026

While dominance of the AI theme in today’s market sometimes feels like it’s descending into speculative excess, as Chart 4 shows, a once-in-a-generation technology can fuel a bull market much longer than most investors may think. We believe investors should not discount this possibility, even as the next wave of AI-related issuance follows the largest IPO in history. How markets absorb this new supply, and where the capital comes from to fund it, could create opportunities for active management as market dislocations emerge.

Past performance is not indicative of future results. The commentary in this report is not a complete analysis of every material fact with respect to any company, industry, or security. The opinions expressed here are not investment recommendations but rather opinions that reflect the judgment of Horizon as of the date of the report and are subject to change without notice. Opinions referenced are as of the date of publication and may not necessarily come to pass. Forward-looking statements cannot be guaranteed.
We do not intend and will not endeavor to provide notice if and when our opinions or actions change. Horizon is not soliciting any action based on this document. This document does not constitute an offer to sell or a solicitation of an offer to buy any security or product and may not be relied upon in connection with the purchase or sale of any security or device. The investments recommended by Horizon are not guaranteed. There can be economic times when all investments are unfavorable and depreciate in value. Clients may lose money.
The MSCI World Index measures the performance of large- and mid-cap stocks across 23 developed markets worldwide, providing broad exposure to developed-market equities. The MSCI EAFE Index tracks large- and mid-cap companies in developed markets outside the U.S. and Canada, including Europe, Australasia, and the Far East. The S&P SmallCap 600 Index (S&P 600) measures the performance of 600 small-cap U.S. companies and is designed to represent the domestic small-cap equity market. The MSCI World Index since 1995 refers to the historical performance of the MSCI World Index beginning in 1995, illustrating long-term returns for developed-market equities. The S&P 500 Index tracks 500 leading large-cap U.S. companies and is widely regarded as the primary benchmark for the U.S. stock market. The Nasdaq-100 Index measures the performance of 100 of the largest non-financial companies listed on the Nasdaq Stock Market, with significant exposure to technology and growth-oriented sectors. The MSCI Emerging Markets (MSCI EM) Index measures the performance of large- and mid-cap companies across 24 emerging market countries, providing broad exposure to developing economies around the world. References to indices or other measures of relative market performance over a specified period of time are provided for informational purposes only. Reference to an index does not imply that any account will achieve returns, volatility, or other results similar to that index. The composition of an index may not reflect the manner in which a portfolio is constructed in relation to expected or achieved returns, portfolio guidelines, restrictions, sectors, correlations, concentrations, volatility or tracking error targets, all of which are subject to change.
Information has been obtained from sources considered to be reliable, but accuracy and completeness cannot be guaranteed.
Horizon is an investment advisor registered with the U.S. Securities and Exchange Commission. Registration does not imply a certain level of skill or training. More information about Horizon’s investment advisory services can be found in our Form ADV Part 2, which is available upon request.
Horizon Investments is a registered trademarks of Horizon Investments, LLC.
© 2026 Horizon Investments, LLC.
NOT A DEPOSIT | NOT FDIC INSURED | MAY LOSE VALUE | NOT BANK GUARANTEED | NOT INSURED BY ANY FEDERAL GOVERNMENT AGENCY

Follow us on:

You are now leaving this website to go to HorizonMutualFunds.com