A Near-Historic 100 Days For Stocks

BigNumber_Image 4.28.25

Equity investors should look beyond the usual suspects these days

This week marks the 100th day of President Trump’s current term in the White House. And while it’s not the absolute worst 100-day post-inaugural period for U.S. stocks in history, it’s awfully close.

Case in point: The S&P 500 has fallen 6.9% since Trump took office on January 20 (see the chart). The only year investors saw a worse first-100-day return was 1972, when stocks were down nearly 10%. Over the long term, the index has averaged a 1.8% gain during this period.

Meanwhile, the once-red-hot Magnificent 7 stocks have collectively declined by almost 17% since the inauguration.

S&P 500’s Return Over First 100 Days of Presidential Term: 2025 Versus Long-Term Average

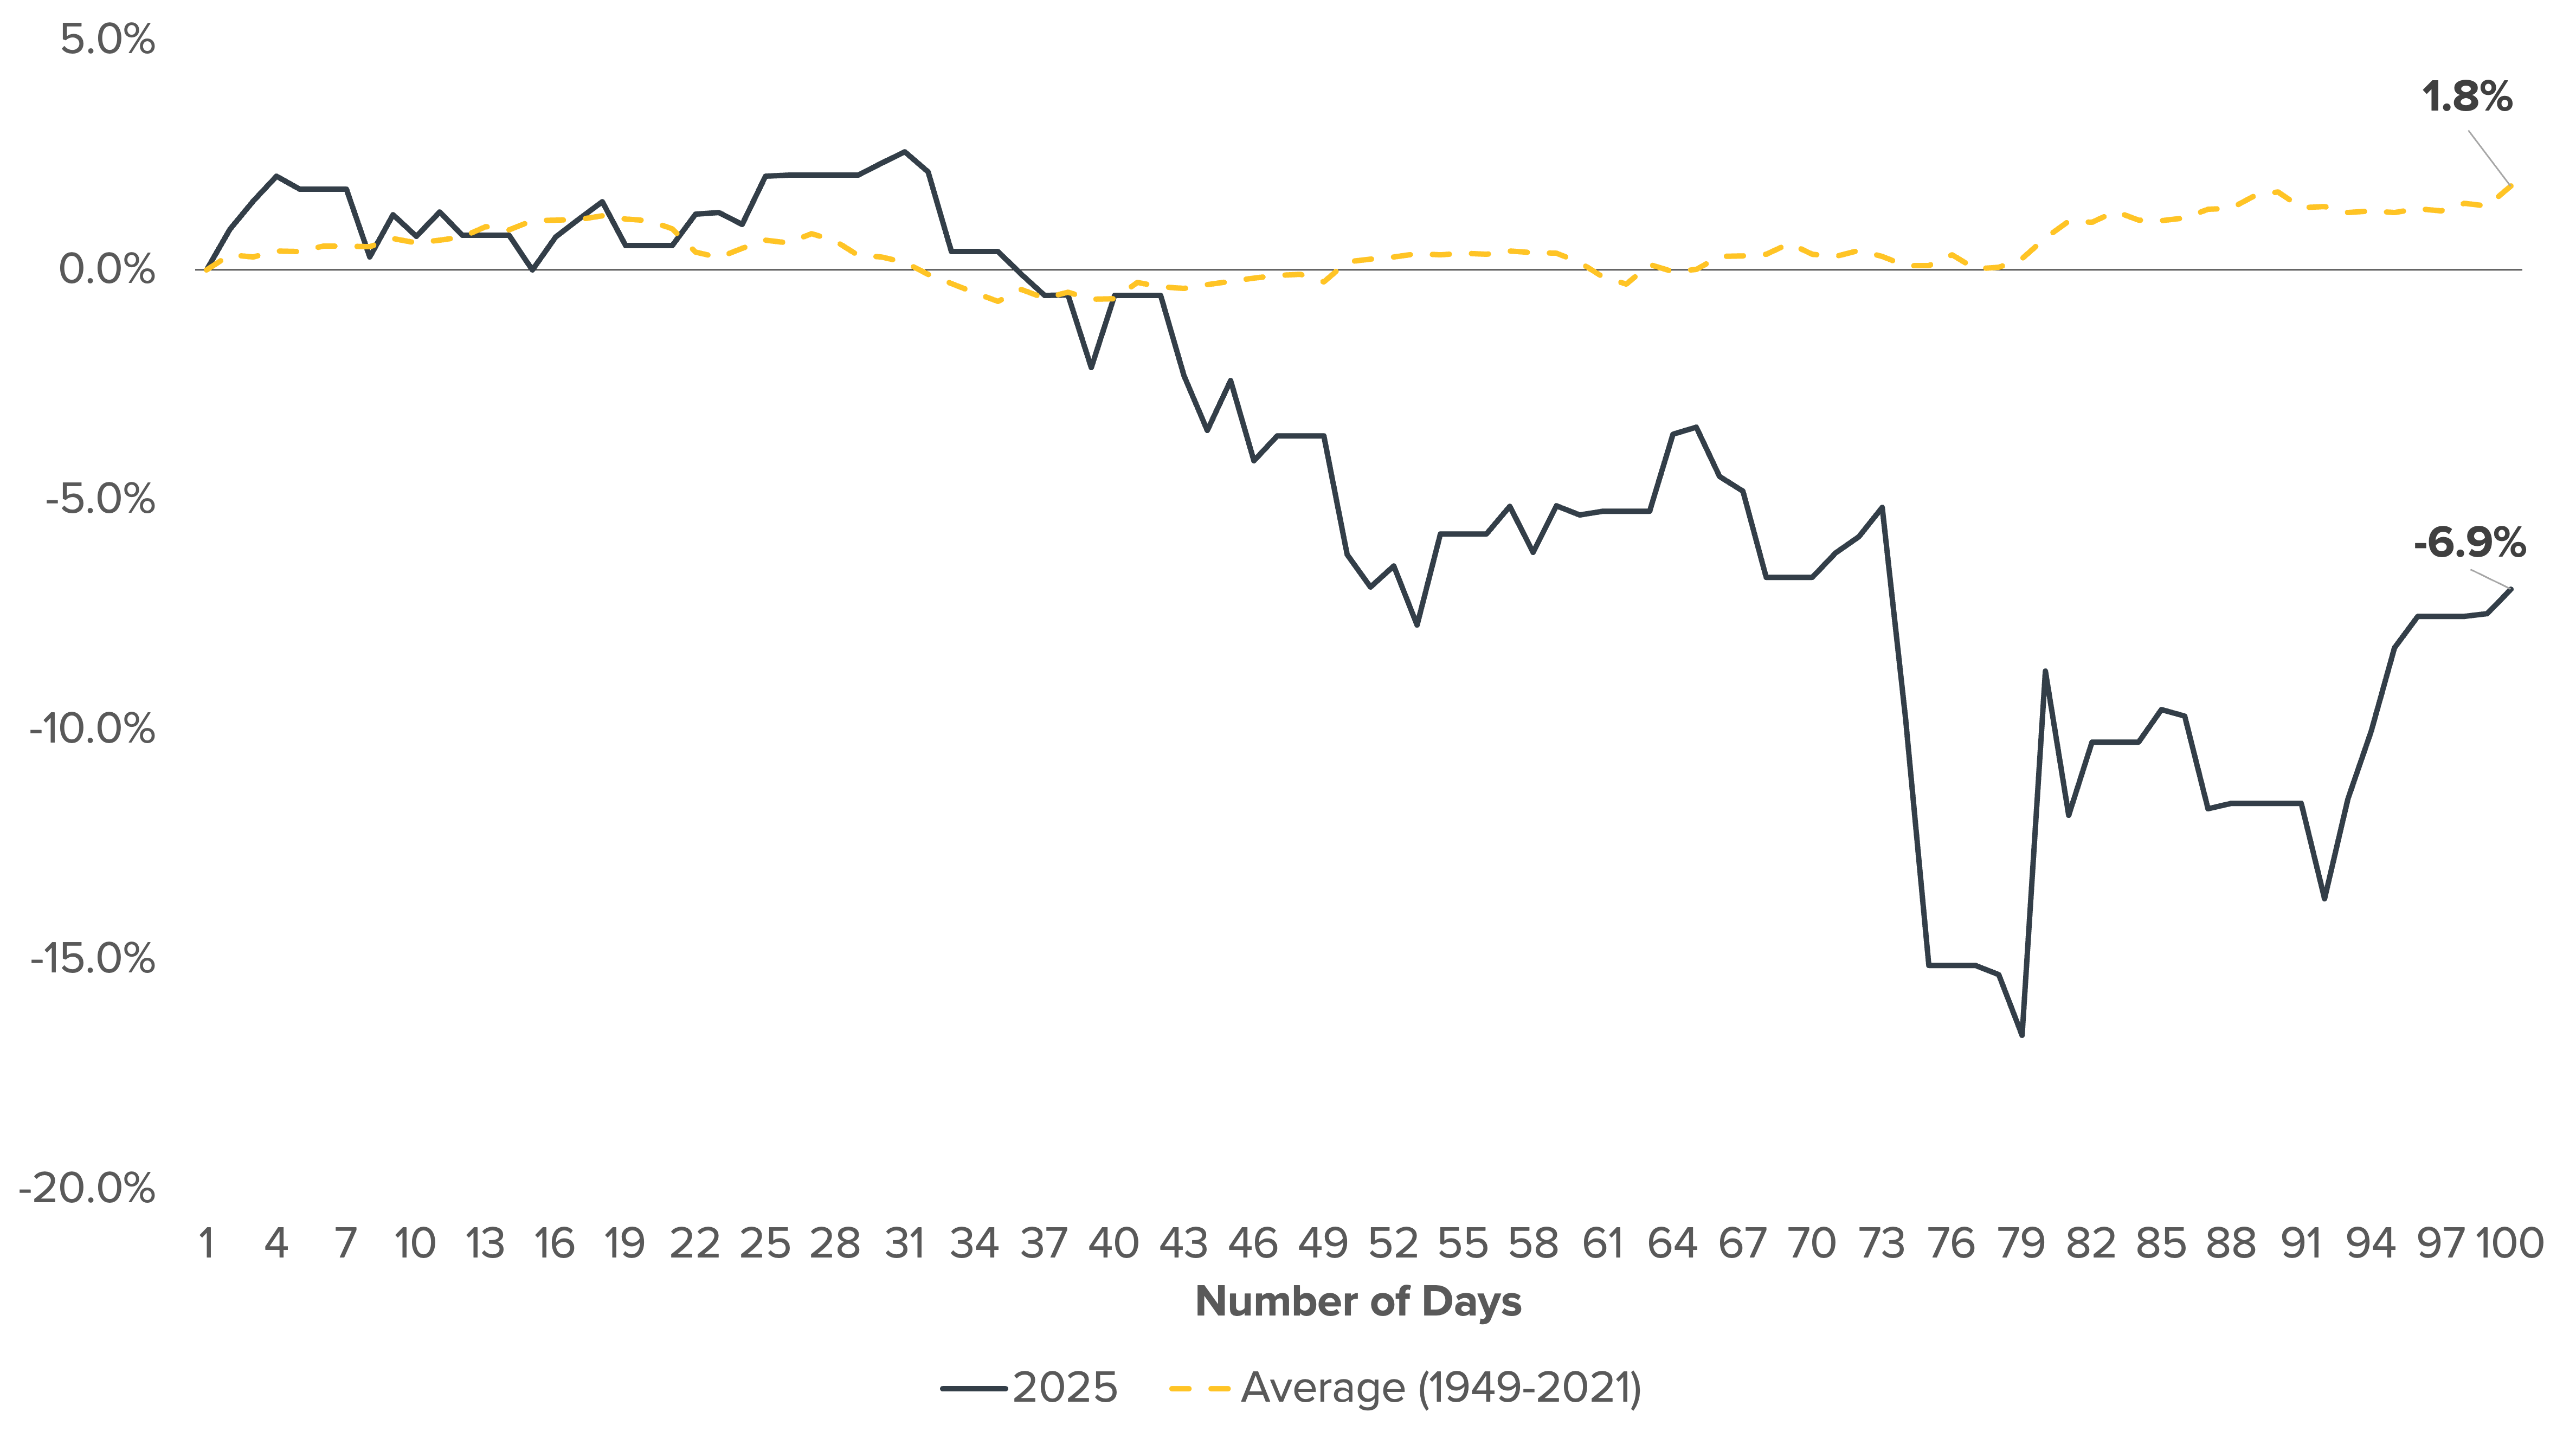
Source: Bloomberg, calculations by Horizon Investments, data as of 04/29/2025.

The stock market delivered better-than-average returns to investors both immediately after the election and during the early days of Trump’s presidency, largely due to expectations that the new administration would focus on deregulation and other pro-business initiatives. Instead, tariffs emerged as the major policy goal. That shift has created significant uncertainty about the prospects for inflation, employment, consumer spending, and other major drivers of economic growth—which, in turn, has weighed heavily on stock prices.

Despite the S&P 500’s near-historic nosedive under Trump thus far, other areas of the equity universe remain strong. For example, international stocks, as measured by the MSCI ACWI ex USA Index, are up 7.9% since January 20. Even among U.S. stocks, sectors such as utilities and consumer staples are outpacing the broader market.

The upshot: We believe well-diversified portfolios can help investors weather recent U.S. underperformance and stay on track toward their key goals-based investment objectives.

The Standard and Poor’s 500, or simply the S&P 500, is a stock market index tracking the stock performance of 500 leading companies listed on stock exchanges in the United States. The MSCI ACWI ex USA Index captures large and mid cap representation across 22 of 23 Developed Markets (DM) countries (excluding the US) and 24 Emerging Markets (EM) countries. Contact us for more information. Reference to an index does not imply that any account will achieve returns, volatility or other results similar to that index. The composition of an index may not reflect the manner in which a portfolio is constructed in relation to expected or achieved returns, portfolio guidelines, restrictions, sectors, correlations, concentrations, volatility or tracking error targets, all of which are subject to change. Indices are unmanaged and do not have fees or expense charges, both of which would lower returns. It is not possible to invest directly in an index. Information obtained from third party sources is believed reliable but has not been vetted by the firm or its personnel.
This commentary is written by Horizon Investments’ asset management team. Past performance is not indicative of future results. Nothing contained herein should be construed as an offer to sell or the solicitation of an offer to buy any security. This report does not attempt to examine all the facts and circumstances that may be relevant to any company, industry, or security mentioned herein. We are not soliciting any action based on this document. It is for the general information of clients of Horizon Investments, LLC (“Horizon”). This document does not constitute a personal recommendation or take into account the particular investment objectives, financial situations, or needs of individual clients. Before acting on any analysis, advice, or recommendation in this document, clients should consider whether the security in question is suitable for their particular circumstances and, if necessary, seek professional advice. Investors may realize losses on any investments. Asset allocation cannot eliminate the risk of fluctuating prices and uncertain returns. All investing involves the risk of loss.
The investments recommended by Horizon Investments are not guaranteed. There can be economic times when all investments are unfavorable and depreciate in value. Clients may lose money. This commentary is based on public information that we consider reliable, but we do not represent that it is accurate or complete, and it should not be relied on as such. The opinions expressed herein are our opinions as of the date of this document. These opinions may not be reflected in all of our strategies. We do not intend to and will not endeavor to update the information discussed in this document. No part of this document may be (i) copied, photocopied, or duplicated in any form by any means or (ii) redistributed without Horizon’s prior written consent. Forward-looking statements cannot be guaranteed. Other disclosure information is available at www.horizoninvestments.com.
Horizon Investments and the Horizon H are registered trademarks of Horizon Investments, LLC
©2025 Horizon Investments, LLC.
You are now leaving this website to go to HorizonMutualFunds.com