

Looking for a broader base of market support
As third-quarter earnings season begins, the S&P 500 Index sits just below last week’s all-time closing high. But how strong is the foundation under stocks’ latest push?
One measure has some investors concerned. Currently, 50.2% of S&P 500 stocks are trading above their 200-day moving average. That’s down sharply from the 75% of names that traded above that moving average when the index last peaked (see the chart). The stock market’s breadth has weakened even as the overall market has marched higher.
Market Breadth of S&P 500 Constituents
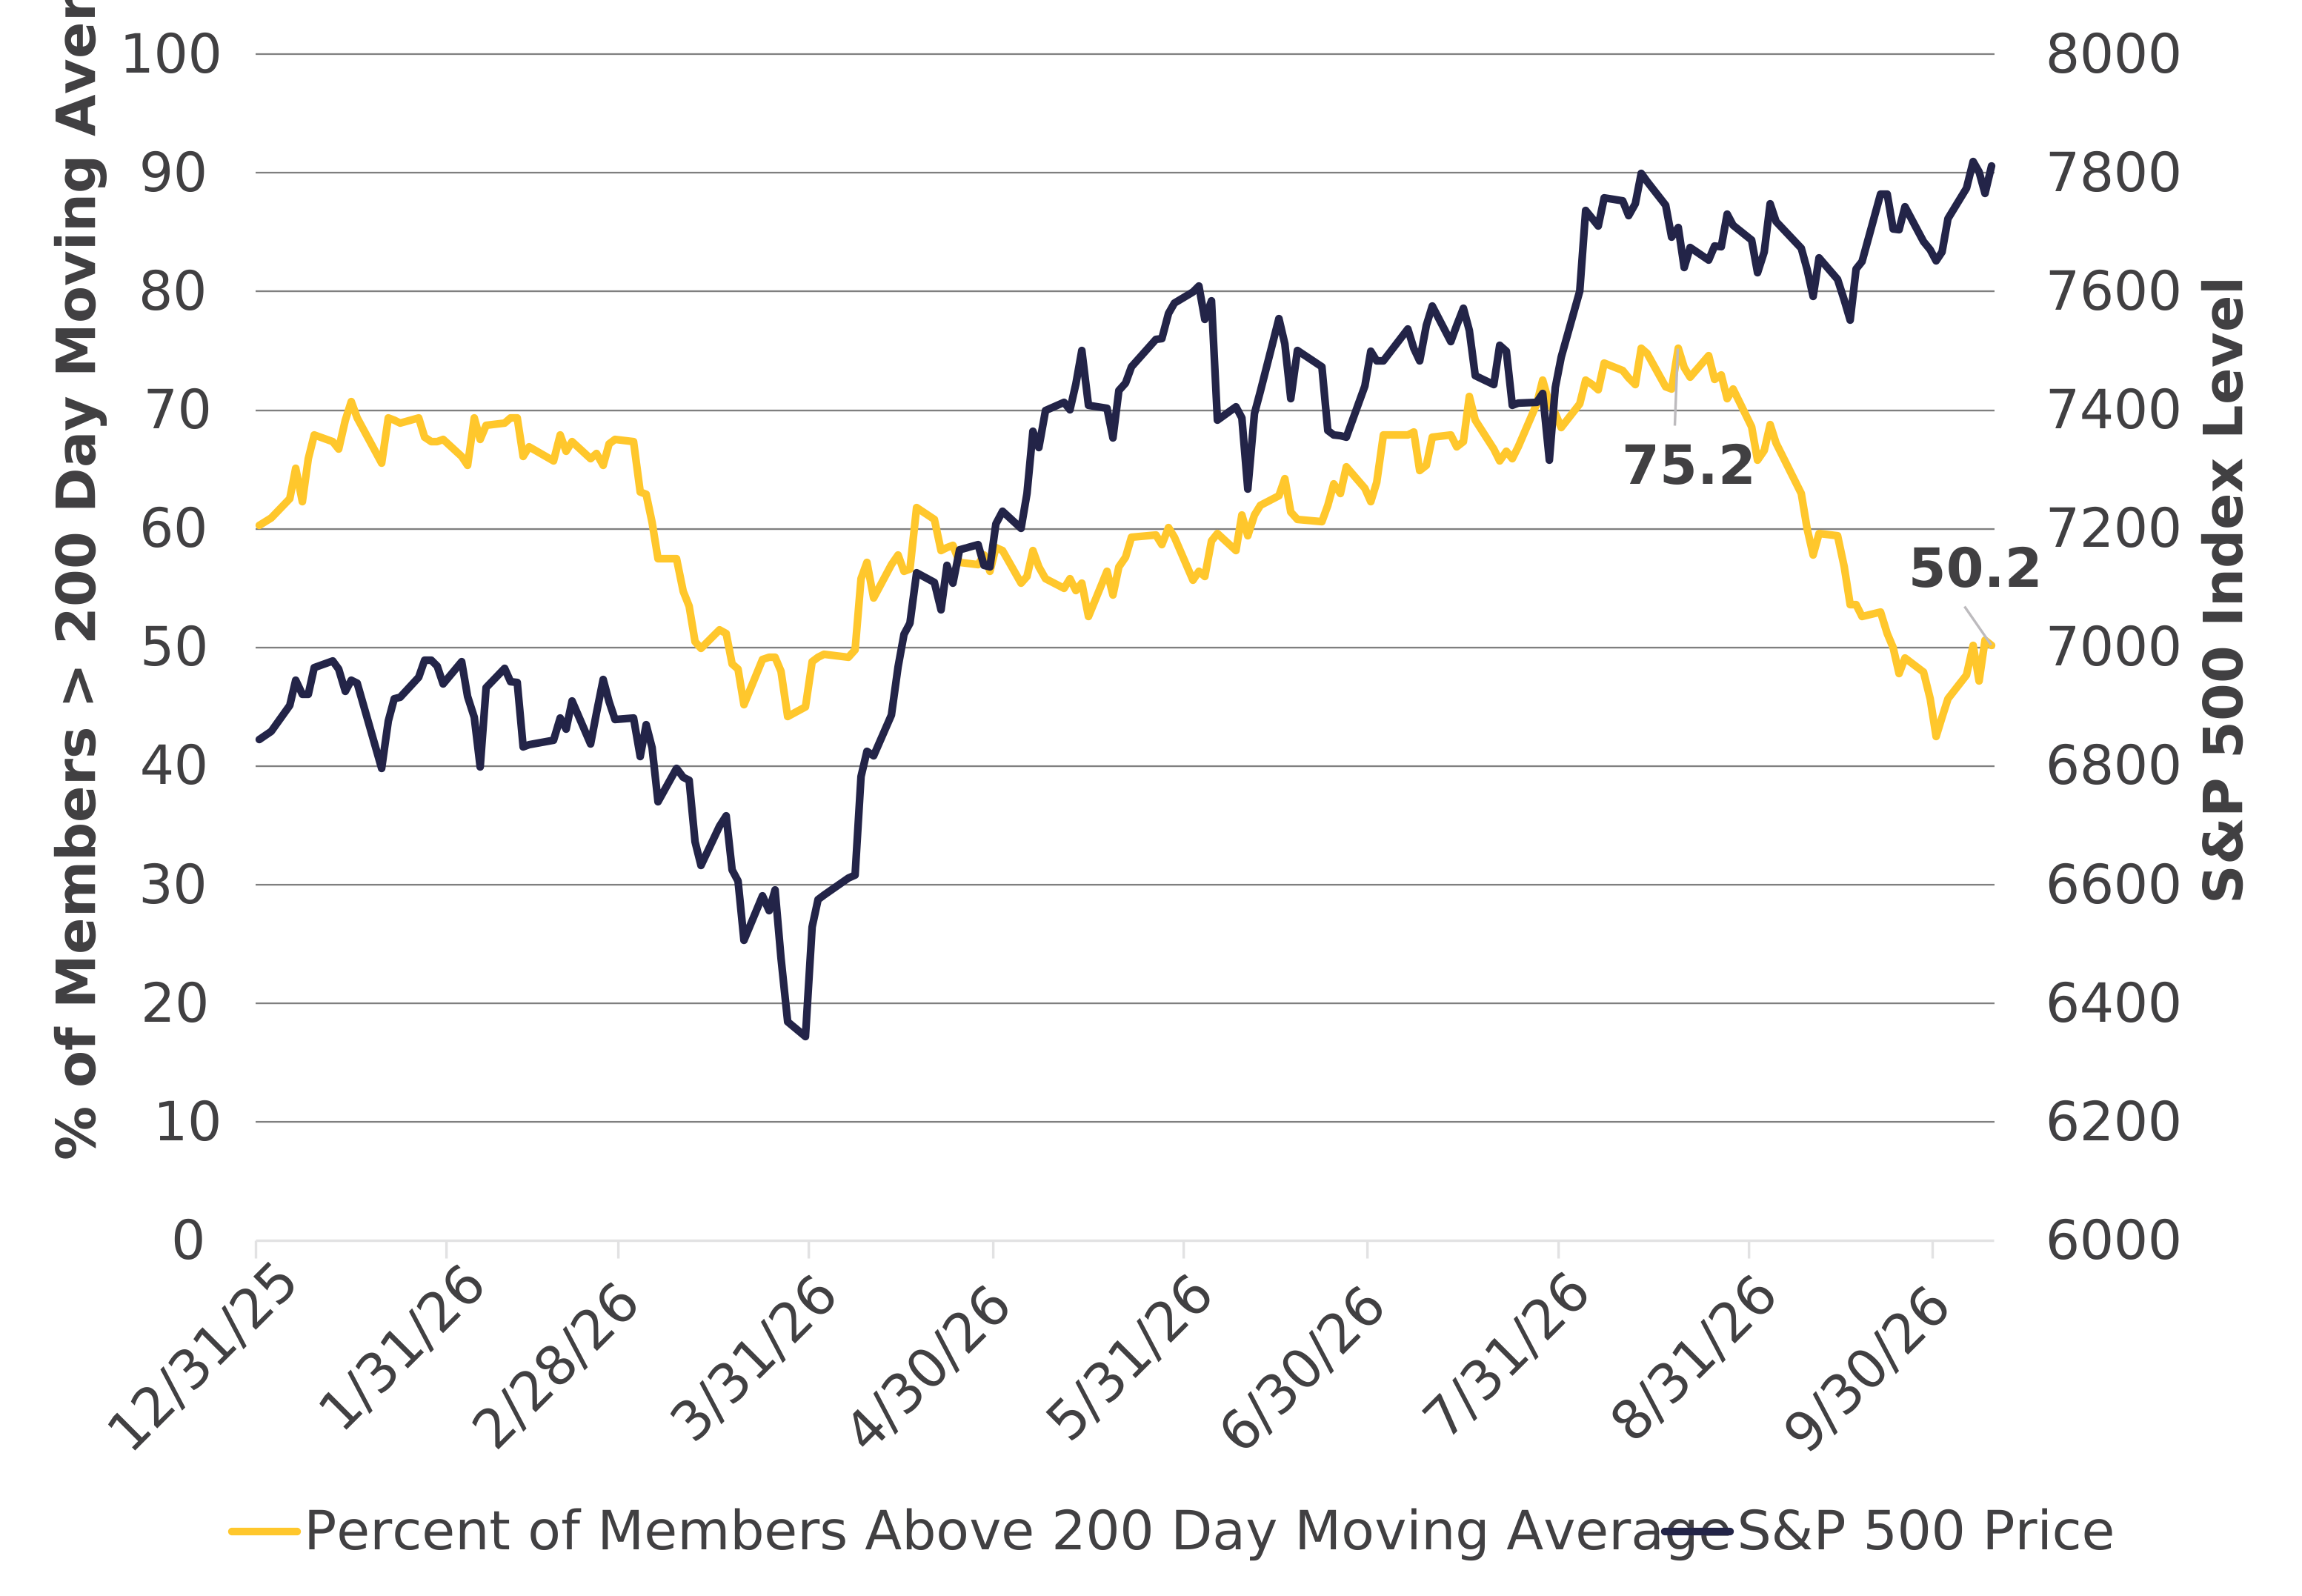
Bloomberg, calculations by Horizon, data as of 10/09/2026
This situation is familiar: Shares of the tech companies powering the AI revolution have largely fueled the market’s recent gains, as they have in other periods over the past few years. Meanwhile, many other sectors (healthcare, consumer goods, etc.) are either flat or down, as investors fear that higher interest rates could hurt many companies’ earnings growth.
The good news: Robust earnings growth has remained widespread across the market this year and is even accelerating, which are facts investors may not fully appreciate. That growth has so far overpowered interest-rate headwinds, especially since higher rates largely reflect economic strength rather than restrictive financial conditions.
As earnings come in over the next several weeks, many market sectors may perk up and join the rally. With many stocks below their highs, continued strong earnings growth across sectors could lift more stocks and help the broader market rise in the coming months.