This commentary is written by Horizon’s asset management team. Past performance is not indicative of future results. Nothing contained herein should be construed as an offer to sell or the solicitation of an offer to buy any security. This report does not attempt to examine all the facts and circumstances that may be relevant to any company, industry, or security mentioned herein. We are not soliciting any action based on this document. It is for the general information of clients of Horizon Investments, LLC (“Horizon”). This document does not constitute a personal recommendation or take into account the particular investment objectives, financial situations, or needs of individual clients. Before acting on any analysis, advice, or recommendation in this document, clients should consider whether the security in question is suitable for their particular circumstances and, if necessary, seek professional advice. Investors may realize losses on any investments. Asset allocation cannot eliminate the risk of fluctuating prices and uncertain returns. All investing involves the risk of loss.
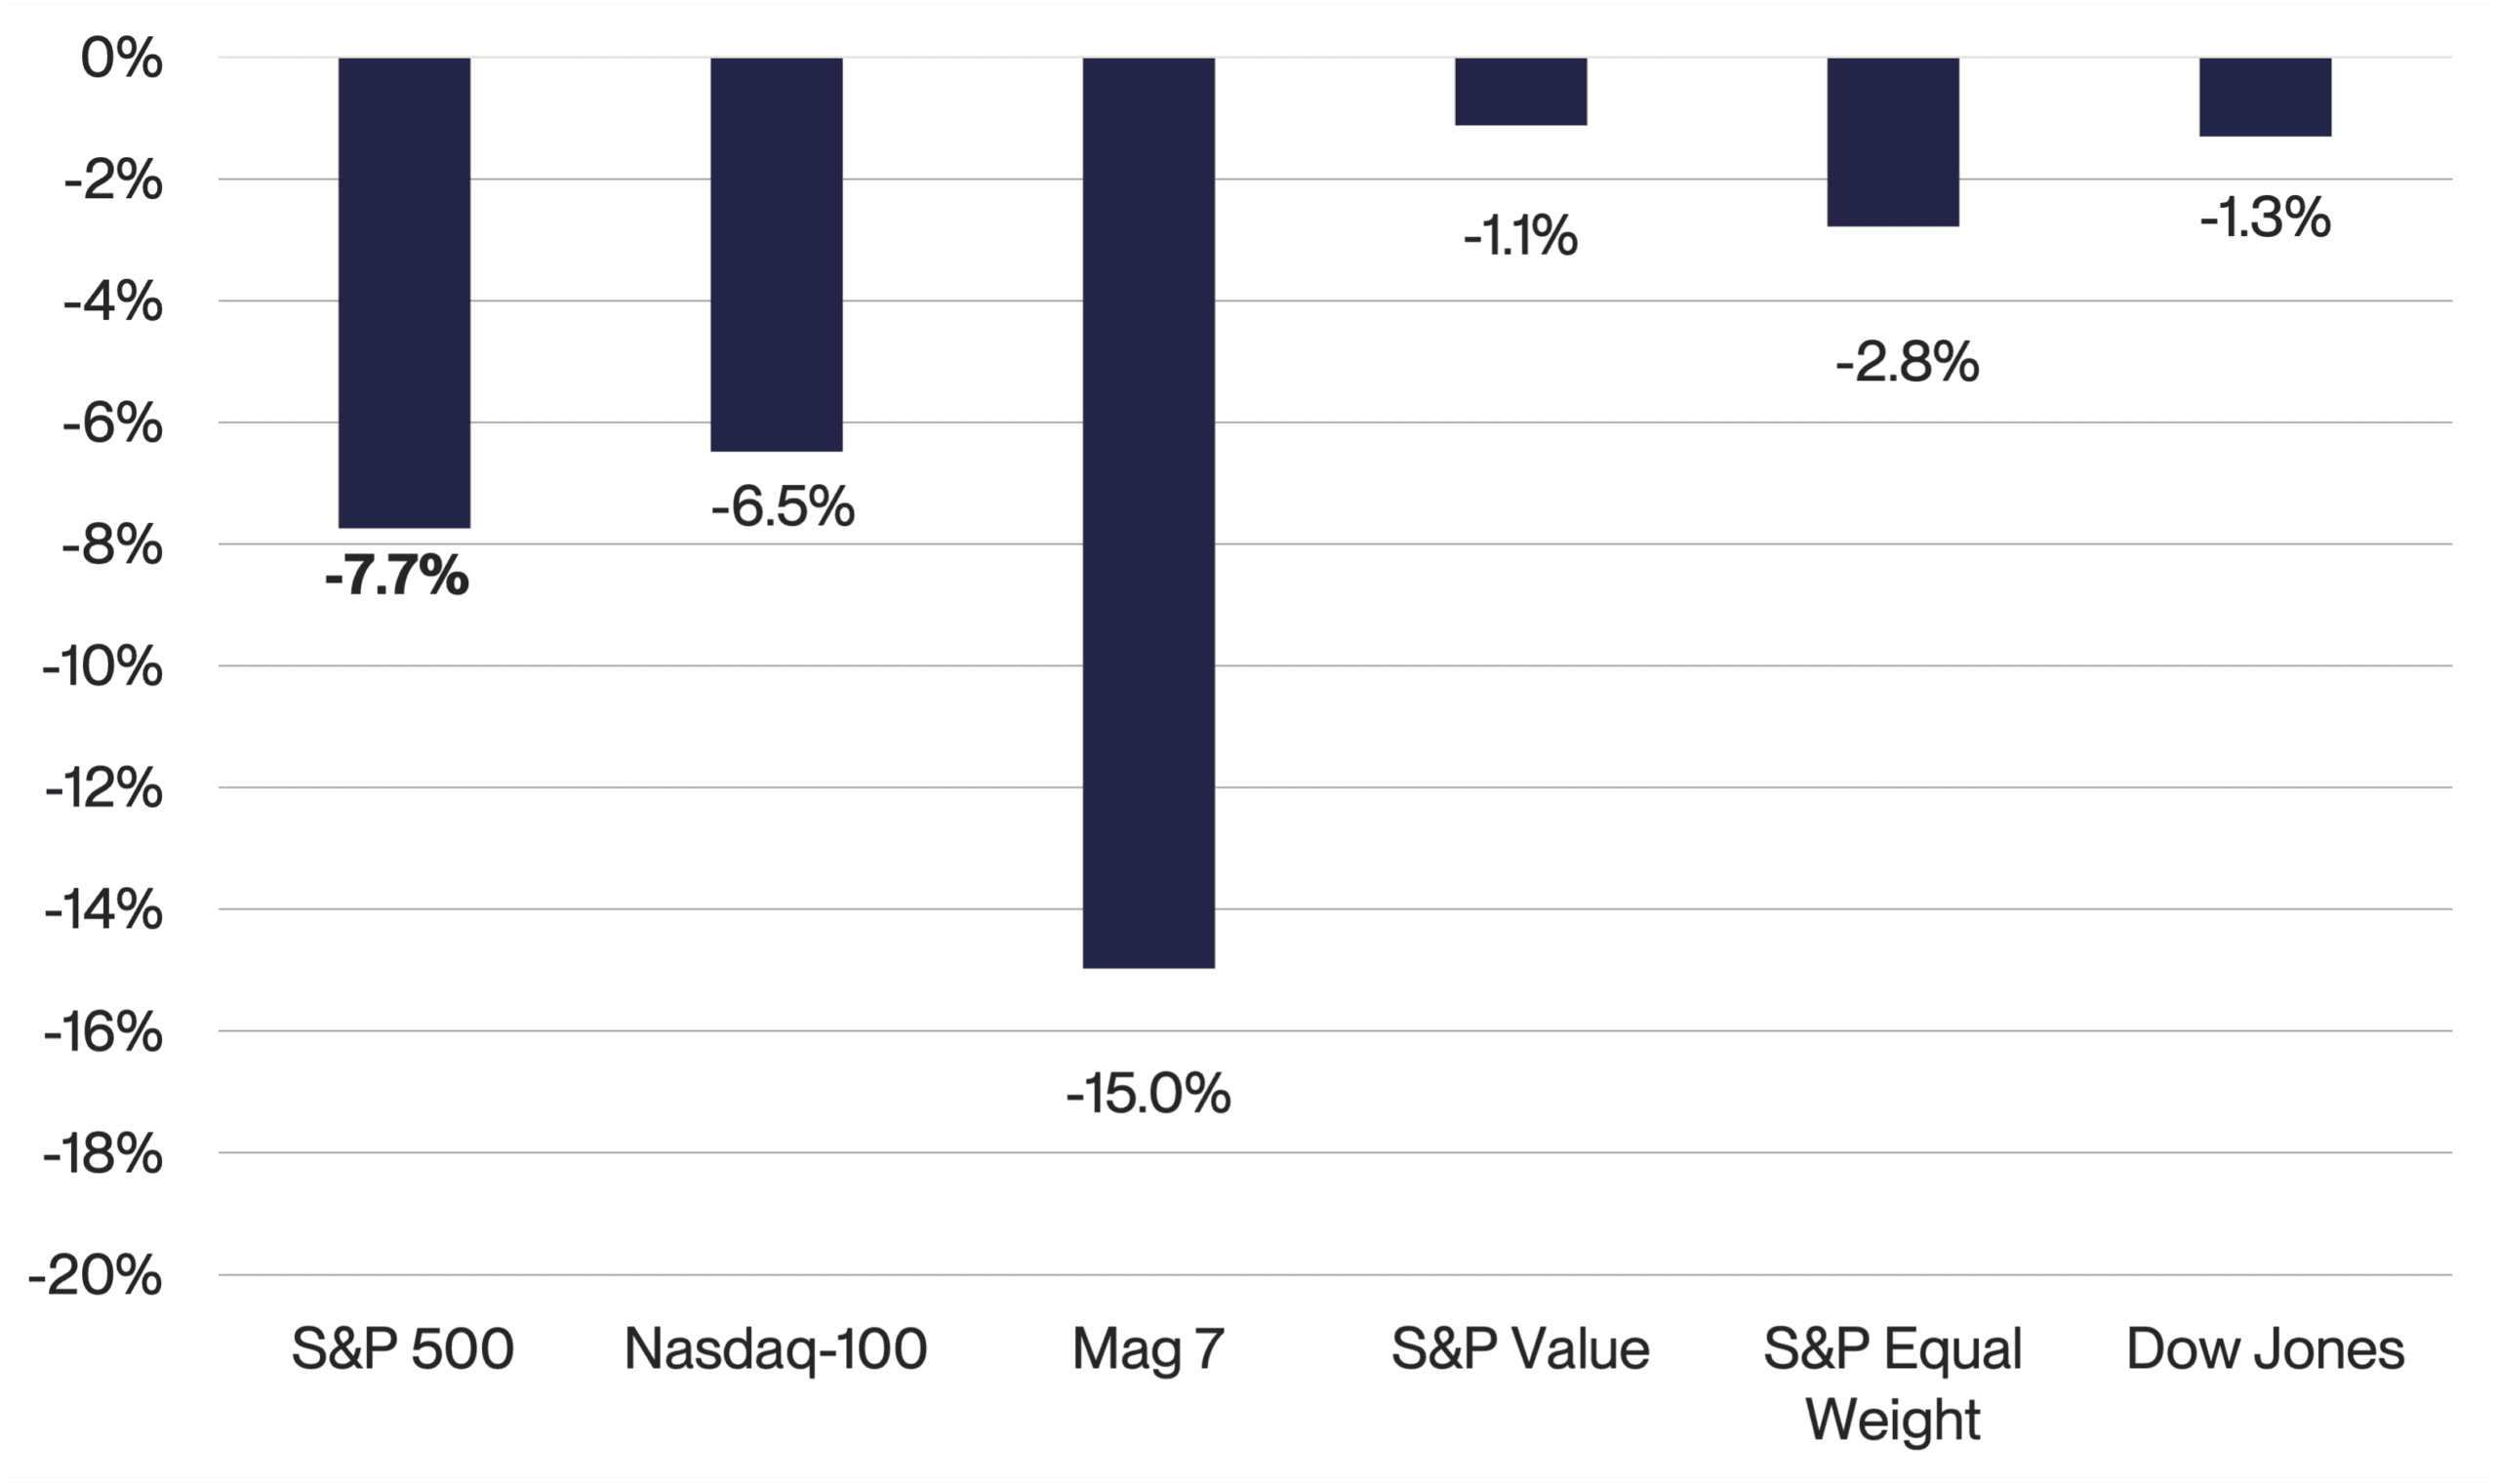
The S&P 500 Index is a market capitalization-weighted index that measures the performance of 500 leading publicly traded U.S. companies and is widely regarded as a benchmark for the U.S. large-cap equity market. The Nasdaq-100 Index is a modified market capitalization-weighted index that measures the performance of 100 of the largest non-financial companies listed on the Nasdaq Stock Market, with significant exposure to technology and growth-oriented sectors. The Magnificent 7 (Mag 7) refers to seven of the largest U.S. technology and technology-related companies—Apple, Microsoft, Nvidia, Amazon, Alphabet, Meta Platforms, and Tesla—that have played an outsized role in recent U.S. equity market performance. The Mag 7 is not an official index. The S&P 500 Value Index measures the performance of the value segment of the S&P 500 Index by selecting companies with relatively strong value characteristics, such as lower price-to-book, price-to-earnings, and price-to-sales ratios. The S&P 500 Equal Weight Index measures the performance of the same 500 companies included in the S&P 500 Index but assigns each company an equal weight rather than weighting companies based on market capitalization. The Dow Jones Industrial Average is a price-weighted index that measures the performance of 30 large, established U.S. companies representing a broad cross-section of the U.S. economy. References to indices, or other measures of relative market performance over a specified period of time are provided for informational purposes only. Reference to an index does not imply that any account will achieve returns, volatility or other results similar to that index. The composition of an index may not reflect the manner in which a portfolio is constructed in relation to expected or achieved returns, portfolio guidelines, restrictions, sectors, correlations, concentrations, volatility or tracking error targets, all of which are subject to change. It is not possible to invest directly in an index. Information obtained from third party sources is believed reliable but has not been vetted by the firm or its personnel.
The investments recommended by Horizon are not guaranteed. There can be economic times when all investments are unfavorable and depreciate in value. Clients may lose money. This commentary is based on public information that we consider reliable, but we do not represent that it is accurate or complete, and it should not be relied on as such. The opinions expressed herein are our opinions as of the date of this document. These opinions may not be reflected in all of our strategies. We do not intend to and will not endeavor to update the information discussed in this document. No part of this document may be (i) copied, photocopied, or duplicated in any form by any means or (ii) redistributed without Horizon’s prior written consent. Forward-looking statements cannot be guaranteed. Other disclosure information is available at www.horizoninvestments.com.
Horizon Investments is a registered trademark of Horizon Investments, LLC
©2026 Horizon Investments, LLC.